Wednesday, December 2, 2015

The Fallacy of The Canonical Dashboard(s)

I've once again come across an article promulgating the conventional wisdom that runs along the lines of: "Important information about the Dashboard (or two, or three) your business needs."
It's here: Why every business needs two dashboards for clear flying, and contains this passage:

The two dashboards every business needs

"But it actually isn’t enough to have just one dashboard; I believe every business needs two dashboards: strategic and operational. Like the cockpit instruments in a fighter jet, they allow the executive to know exactly where he or she is at any given time and focus on getting to the destination in one piece."

Putting aside the unfortunate, and by now antiquated, fighter jet cockpit metaphor, the article recognizes that one dashboard isn't enough. But it continues to promote the idea that there is a small set (in this case: two) dashboards that, if carefully considered, can provide the information decision makers need to run their business.

This is an anachronistic view of the world of business data analysis that doesn't recognize developments of the past decade that have moved beyond its limitations.

In the real world, any small set of canonical dashboards is limited in the information they can convey, and don't extend more than a step or two towards the horizon of useful information.

The idea that there's a limited view of one's information space that's adequate for monitoring and decision-making is rooted in historical factors. Briefly: because it took very substantial amounts of time, energy, money, and other resources required to create information delivery artifacts, e.g. dashboards, people became conditioned to the idea that there was a limited view that, once identified, designed, built, and delivered, would be adequate for their information needs. This was always an artificial limitation, an unfortunate (and in reality unnecessary) consequence of and concession to the deficiencies of the business data management and analysis environment.

The past decade has seen the emergence of better, faster, low-friction, tools, technologies, and practices that dramatically narrow the gaps between data and the people who need to understand it.

The past five years has seen the increasing awareness of these tools, particularly with Tableau's recognition by Gartner, Forrester, TDWI, and related media and general audience channels.

The implications of the new opportunities have, as in all paradigm shifts, been slower to bubble to the surface, but they're starting to become part of the discourse, even as the traditional message that there's a canonical set of dashboards that's sufficient for running a business persists.

The modern reality is that it's possible to discover and deliver data-based information on an ongoing basis, including but not limited to a small set of pre-identified KPIs in one or two dashboards. There's a very small distance between dynamic data discovery and the composition of relevant analyses into dashboards—this is a fundamental departure from the traditional BI world, and marks a qualitative shift in how effective business data analysis can be pursued. It's now possible to provide the information people need to make decisions from the relevant data as they need it, even if it's not previously been formalized in pre-constructed forms: dashboards, scorecards, etc.

Organizations that recognize that they're no longer constrained by the traditional limitations can take advantage of the new opportunities and dramatically improve their data-based decision making abilities. One of the first steps is recognizing that they can access, analyze, and understand their data as needed, rather than speculating about future information needs and spending time, energy, and effort tackling technical implementation efforts for potential payoff. As they absorb this concept, people recognize that they no longer need be shackled to one, two, or some small number of discrete dashboards.

Tuesday, November 24, 2015

Hack Academy - Multiple Moving Averages

Hack Academy – explaining how Tableau works in real world examples.

Note: this post is a work in progress.

This session delves into the workings behind the solution to this Tableau Community request for assistance: Showing maximum and minimum with a calculated moving average. Please refer to the Tableau Community posting for the full details.

In the post the person asking for help explained that she was looking to have a chart like this:
and described her goal thus:

"So I want to aggregate the previous 4 years worth of data (and not show as individual years), average it for each week and then display it as a 3 week rolling average (which I've done) and also calculate and display the maximum rolling average and the minimum one too. That way it can be easily seen if the rolling average for this current year falls within the expected range as calculated from the previous 4 years worth of data."

The Solution

One of Tableau's Technical Support Specialists—community page here, provided a workbook containing a solution; it's attached to the original post. She also provided a step-by-step recipe for building the solution worksheet. Cosmetic adjustments to the solution to make it easier to identify and track the Tableau elements have been made.

The blue lines identify the parts and something of the relationships between them. The complexity of the parts and their relationships is difficult for inexperienced people to wrap their heads around.

This post expands upon the solution by looking behind the curtain, showing the Tableau mechanisms employed—what they do and how they work. It does this by providing a Tableau workbook, an annotated set of diagrams showing how the worksheets' parts relate to one another, and explanatory information.

The Solution Recipe
The worksheet's caption lays out the steps for generating the desired visualization. This is helpful in getting to the solution, but doesn't surface the Tableau mechanisms involved.
The rest of this post lays out the Tableau mechanisms, how they work, and by extension how they can be understood and assimilated so they can become tools in one's Tableau toolbox, available for use when the needs and opportunities arise.
The Solution Recipe, annotated
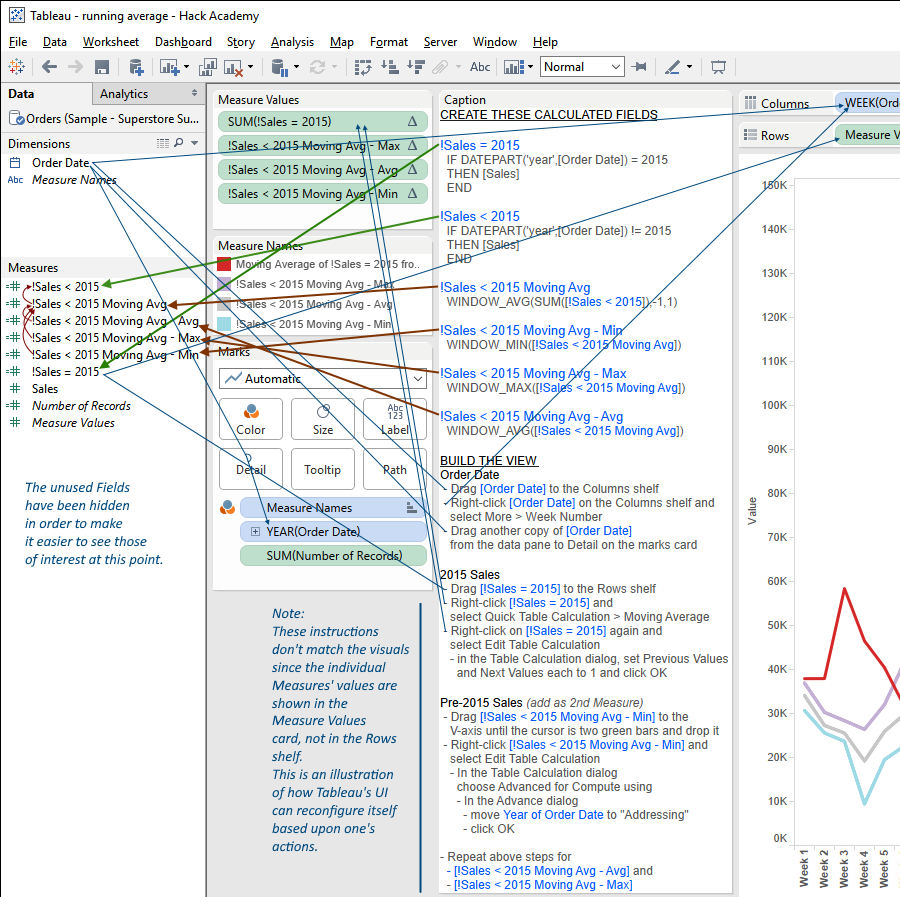
In this diagram the arrows indicate the instructions' targets and the effects of the recipe's steps.
– The green arrows indicate record-level calculated fields
– The red arrows indicate Tableau Calculation fields
– The thin blue lines show how fields are moved
The first thing that jumps out is just how fiendishly complicated this is. Even though less than half of the instructions have been annotated the number and complexity of the relationships is almost overwhelming. In order to achieve analytical results like this, the analyst must first be able to understand this complexity well enough to be able to generate from it the specific desired effects. One of Tableau's deficiencies is that all of this mastering and managing this complexity is left up to the analyst, i.e. Tableau provides virtually nothing in the way of surfacing the parts and their relationships in any way that reveals their relationships in a way that allows for easy comprehension and manipulation.
Once the instructions reach the "2015 Sales" step the diagram doesn't show the Measures in the location the recipe indicates. Instead of them being on the Rows shelf (where the recipe puts !Sales = 2015) they're on the Measure Values card. This is because once there are multiple Measures in play, organized in this manner, they're configured via the Measure Values card and the Measure Names and Measure Values pills. This is one of the things that makes it difficult for people new to Tableau to puzzle out what the parts are and how they work and interact.
Implementing the Solution

The following Tableau Public workbook is an implementation of the Recipe.

The Inner Workings

Although the Public Workbook above implements the solution and is annotated with descriptive information it doesn't go very deep in surfacing and explaining the Tableau mechanisms being taken advantage of—how they work and deliver the results we're looking to achieve. This section lifts Tableau's skirts, revealing the behind the scenes goings on.

Tableau's Data Processing Pipeline
One of the things that can be difficult to wrap one's head around is Tableau's mechanisms for accessing and processing data, from the underlying data source through to the final presentation. Tableau processes data in (largely) sequential stages, each operating upon the its predecessor's data and performing some operations upon it. This solution employs multiple stages; this section lays out their basics, illustrating how they're employed to good effect.

Tableau applies different data processes and operations at different stages—in general, corresponding to the different 'kind' of things that are present in the UI. These stages are largely invisible to the casual user, and their presence can be difficult to detect, but understanding them is critical to being able to understand how Tableau works well enough to generate solutions to novel situations.

The main mechanism: selective non-Null Measures presentation
At the core of the solution is the distinction between data structure and presentation. In this situation there are, in effect, two data layers in play; we represent the stages as layers in order to help visualize them.

The basic ideas are: when displaying data Tableau will only present Marks for non-Null values; and Table Calculations can be used to selectively instantiate values in different layers. The underlying layer is where the data is stored upon retrieval from the database. The surface layer is where presents selected data from the underlying layer to the user. The key to this solution is that Tableau only presents some of the underlying layer's data—that required to show the user what s/he's asking to see.

Demonstration Tableau Public workbook.

This Workbook contains a series of Worksheets that demonstrate these Tableau mechanisms.

This Worksheets are shown below, along with descriptions of what's going on.

Download the Workbook to follow along.

Setting up the data.
The fields used to illustrate the data processing:

!Sales = 2015
 IF DATEPART('year',[Order Date])=2015
 THEN [Sales]
 END

!Sales = 2015 (Null)
 IF DATEPART('year',[Order Date])=2015
 THEN [Sales]
 ELSE NULL
 END

!Sales = 2015 (0)
 IF DATEPART('year',[Order Date])=2015
 THEN [Sales]
 ELSE 0
 END

The major difference between the fields is whether they evaluate to Null or 0 (zero) when Order Date's Year is not 2015. The first two fields evaluate to Null—the first implicitly, the second explicitly. The third evaluates to 0.

This is the distinction upon which the solution's deep functionality depends. Recall that Tableau only presents non-Null data; this solution takes advantage of this by selectively constructing the Null and non-Null presentation Measures we need.
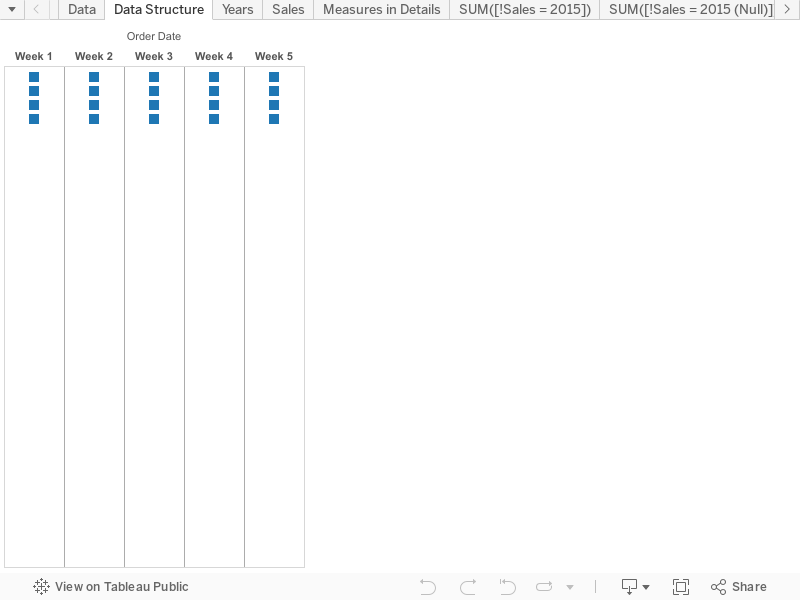
The data structure.

This viz shows the basic data structure needed to support our goal of comparing Weekly Moving Averages for each of the Order Date Years:

  • there are columns for each Week (filtered here to #s 1-5); and
  • each week has 'slots' for each of the four Order Date Years.
Tableau shows Marks for each combination of Order Date Year and Week for which there's data, in this case the Marks are squares. This is one of Tableau's magic abilities that really adds tremendous value in assisting the analytical process (and in many cases is itself a very valuable diagnostic tool).
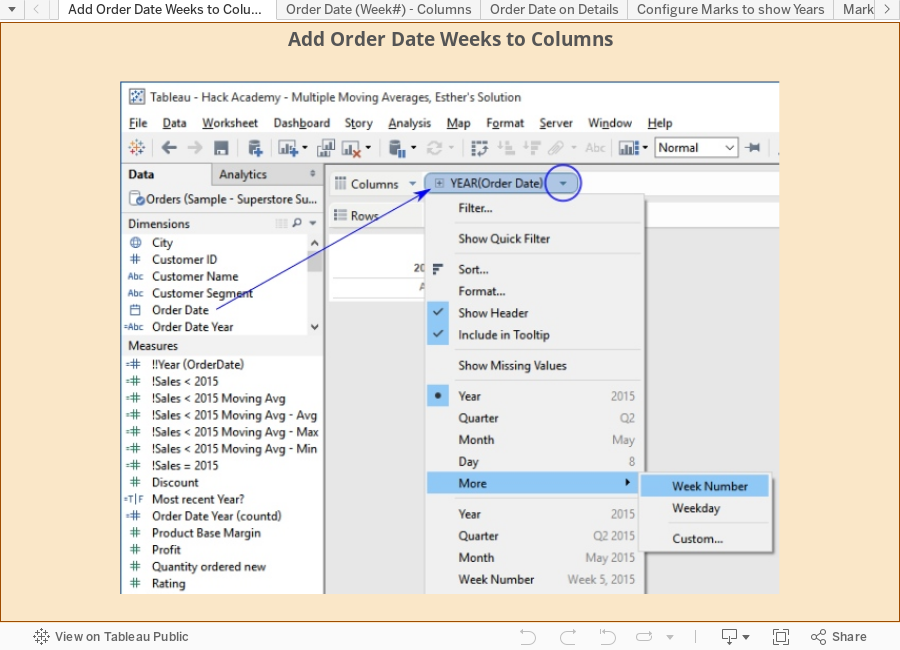
Showing the Years.

Right-clicking Year (Order Date) in the Marks card and selecting "Label" tells Tableau to show the Year for each Mark.

This confirms the data structure, and is one of the basic steps in building complex visualizations.

The Yearly Sales.

In this viz Sales has been added to the Marks card—Tableau applies its default SUM aggregation and configured to be used as the Marks' labels.

As shown, Tableau uses the Sales sum for each Year and Week as the label.
This can be confirmed to show the accurate values, if desired, via alternate analyses.

Note that the viz shows the actual Year & Week Tales totals, not the Sales compared to the same Week in 2015.

Measures on the Marks card.

In this viz Sales has been replaced on the Marks card by the three Measures shown.

Our objective is to see how Tableau presents each of them vis-a-vis the base data structure.

Presenting the 2015 Sales.

SUM(!Sales = 2015) has been used as the Marks' label. As we can clearly see, there's only one Mark presented for each Week. One may wonder: why is only one Mark shown for each week when we know from above that there are four Years with Sales data for each?

In this case, Tableau is only presenting the Marks for the non-Null measures in each Year/Week cell, because the !Sales = 2015 calculation
  IF DATEPART('year',[Order Date])=2015
  THEN [Sales]
  END
results in Null values for each Year other than 2015, so there's nothing for Tableau to present.

One potential source of confusion is that the "Null if Year <> 2015" result for the !Sales = 2015 calculation is implicit, i.e. Tableau provides the Null result by default in the absence of a positive assignment of a value when the Year is not 2015.

Presenting the 2015 or Null Sales.

This viz has the same outcome as the one above.

The difference is that the calculation for
  IF DATEPART('year',[Order Date])=2015
  THEN [Sales]
  ELSE NULL
  END
explicitly assigns NULL (also Null) to the non-2015 Years' values.

Using an explicit NULL assignment is advised as it minimizes the cognitive burden on whomever needs to interpret the calculation in the future.

Presenting the 2015 or 0 Sales.
Recreating the viz – an alternate method.

From this point we're going to be building the viz from the bottom up, showing how the constituent parts operate and interact with each other.

Sales – Total, 2015, & pre-2015
First up: making sure that the Sales calculations for Sales for pre-2015 and 2015 are correct.
The calculations are correct—they sum up to the total of all Sales.
Configure 2015 Sales to be the 3-week Moving Average
The moving average for 2015 Sales is generated by configuring the SUM(!Sales = 2015) measure as a Quick Table Calculation in the viz.
The Steps:
  1. Activate the SUM(!Sales = 2015) field's menu
  2. Select "Quick Table Calculation", then choose "Moving Average"
    Tableau will set up the standard Moving Average Table Calculation, which uses the two previous and current values as the basis for averaging.
    Since this isn't what we're after, we need to edit the TC.
  3. Select "Edit Table Calculation" (after activating the field menu again)
    Configure as shown, so that Tableau will average the Previous, current, and Next values.
    Note: The meaning of "Previous Values", "current", and "Next Values" is inferred from the "Moving along: - Table (Across)"
  4. The "Compute using" field option shows the same "Table (Across)" value as the "Moving along" option in the Edit Table Calculation dialog.
  5. Add !2015 Sales back to the viz.
    There are a number of ways to accomplish this—most common are dragging it from the data window, and using the Measure Names quick filter.
    Why do this?
    Configuring the Table Calculation in steps 1-4 changed the SUM(!Sales = 2015) field in the Measures Value shelf from a normal field to a Table Calculation field (indicated by the triangle in the field's pill). Adding SUM(!Sales = 2015) back to Measures Values provides the opportunity to use its values in illustrating how the Moving Averages are calculated.
How it works:
For each Moving Average value, Tableau identifies the individual SUM(!Sales = 2015) values to be used then averages them.
The blue rectangles in the table show individual Moving Average values, pointing to the referenced "SUM(!Sales = 2015)" values.
There are three different scenarios presented:
  • Week 1 — there is no Previous value, so only the current and Next values are averaged.
  • Week 4 — averages the Week 3 (Previous), Week 4 (Current), and Week 5 (Next) values.
  • Week 7 — there is no Next value, so only the Previous and current values are averaged.
Note:
There's no need to include SUM(!Sales = 2015) in the visualization to have the Moving Average Table Calculation work. I've added it only to make explicit how Tableau structures, accesses, and interprets the data it needs for the presentation it's being asked to deliver.
Pre-2015 Sales 3-week Moving Average - the default configuration
Please note: this is implemented using a persistent Calculated field coded as a Table Calculation: !Sales < 2015 Moving Avg
This is a different approach than using the in-viz configuration of the 2015 Sales shown above. There are differences in the two approaches, some obvious, some subtle.
The Steps:
  • Add !Sales < 2015 Moving Avg to the Measures Shelf as shown.
    As mentioned above, it can be dragged in from the Data Window, or selected in the Measure Names quick filter.
How it works:
When Tableau puts !Sales < 2015 Moving Avg in the viz it applies the default configuration as shown. In this viz the use of Table (Across), as shown in both the Table Calculation dialog and the field's 'Compute using' submenu, provides the desired functionality, i.e. averaging the appropriate !Sales < 2015 values, based upon the field's formula:
  WINDOW_AVG(SUM([!Sales < 2015]),-1,1),
resulting in:
  • Week 1 — only the current and Next values are averaged.
  • Week 4 — averages the Week 3 (Previous), Week 4 (Current), and Week 5 (Next) values.
  • Week 7 — only the Previous and current values are averaged.
Add Order Date Year to Rows
Adding the Order Date Year to Rows instructs Tableau to construct a set of the Measures for each individual Year in the Order Date data.

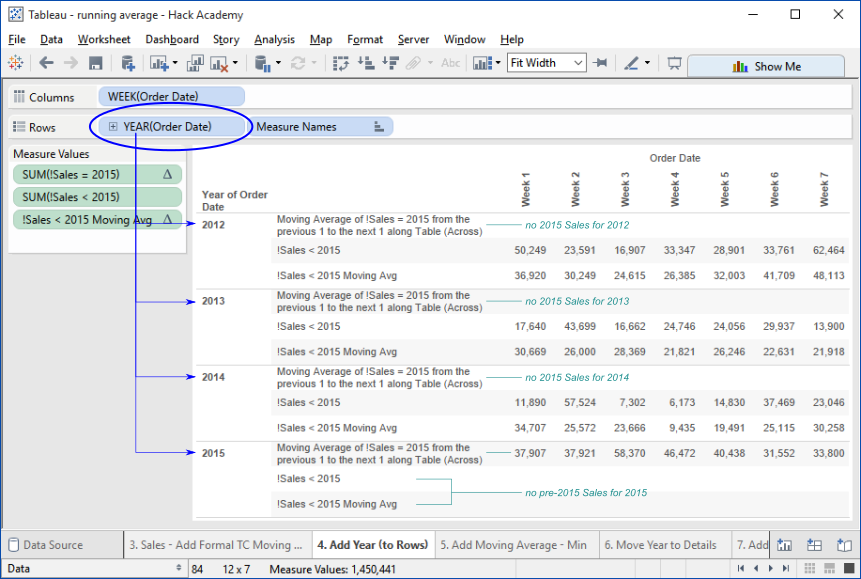
Note that the Measures are only instantiated for those Years for which they are relevant, i.e. the pre-2015 Measures only have values for the years prior to 2015, and the 2015 Moving Average only has values for 2105.

Having these Year-specific values sets the stage for the next part: identifying the Minimum, Average, and Maximum of the pre-2015 Yearly Moving Averages.

For example, as shown in the viz, these values and Min/Max for Week 1 occur thus:
2012 – 36,902 - Max
2013 – 30,669 - Min
2014 – 34,707
and the Average of the Yearly Moving Averages is: 102,278 / 3 = 34,093

How Tableau accomplishes constructing the Measures for this viz is beyond the scope of this post, and it can get complicated.

Add the pre-2015 Sales Moving Average Minimum
Part 1 - add the Field
Drag !Sales < 2015 Moving Avg - Min from the Data window to the Measure Values shelf as shown.

Tableau generates a value for each Week for each Year—for the Years prior to 2015.
   This image has been cropped to show only 2012 & 2013.

As shown in this image, for each Year, all of the !Sales < 2015 Moving Avg - Min values is that of the minimum of the Weeks' values for !Sales < 2015 Moving Avg for that Year. This is because Tableau's default configuration for a Table Calculation Measure added to a viz is Table (Across).

In order to achieve the desired calculation - that each Week's value for !Sales < 2015 Moving Avg - Min reflect the minimum of the values for that Week for the individual Years, we need to configure !Sales < 2015 Moving Avg - Min in the viz, directing Tableau to perform the calculation in the desired manner.
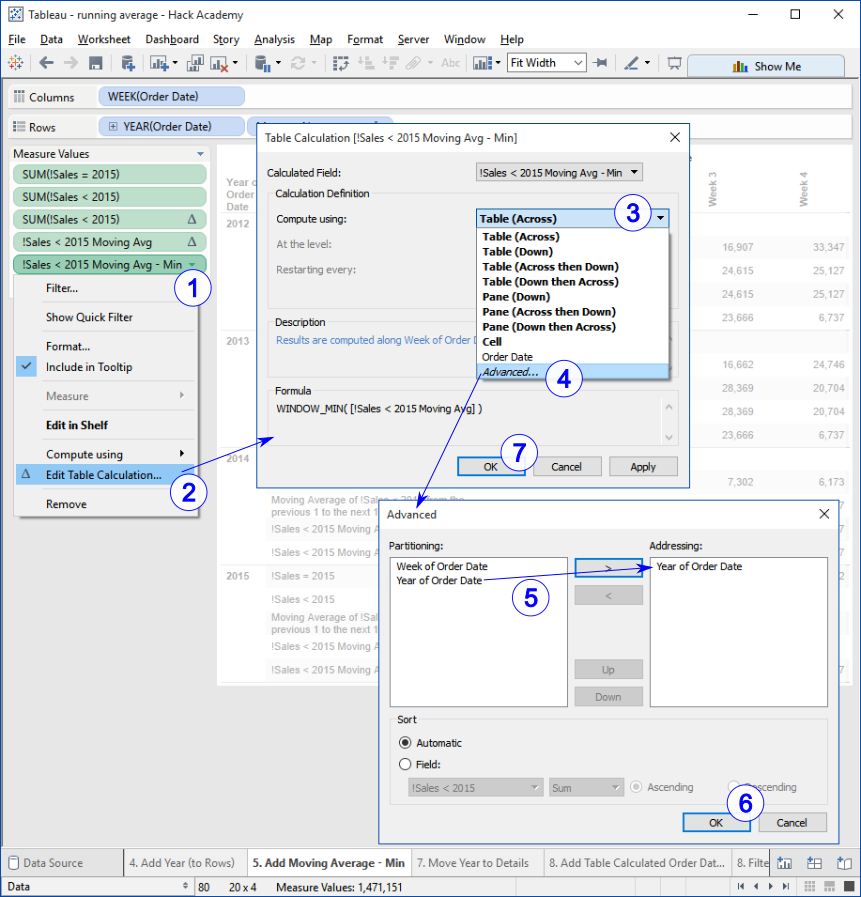
Part 2 - configure the Field
The Steps:
  • 1..2 – operate as shown
  • 3..4 – select the "Compute using: | Advanced" option
    Note the active/default Table (Across) option; as explained above, this is why the default calculation finds the minimum value among the Weeks for each Year.
  • 5 – move "Year of Order Date" from "Partitioning:" to "Addressing:"
    Partitioning and Addressing are fundamental aspects of how Tableau evaluates and calculates Table Calculations. Covering them is beyond the scope of this post.
    Googling "Tableau partitioning and addressing" will lead to a robust set of references.
  • 6..7 – "OK" & "OK" to apply the configuration.
title
image
...

Monday, June 15, 2015

Make Dashboards' formatting consistent.

Has this ever happened to you?

In the course of normal events dashboards get built with a hodgepodge of styles.

For example, in the Workbook to the right the

  • default dashboard has not had any formatting applied, while the
  • formatted dashboard has been formatted.

It's sometimes desirable to have a consistent Dashboard look and feel without going through the tremendously tedious manual process of configuring them individually.

Tableau lacks the ability to enable this, either by setting the defaults you want, or by applying formatting to Dashboards in bulk.

But you can now do it, simply and easily.
There's a Tableau Tool for applying the formatting from a template dashboard to all of the dashboards in a set of workbooks.

Here's a dashboard with the formatting to apply to a selected set of Workbooks.

We'll see below how to make this happen–it's a pretty simple matter of running the appropriate Tableau Tool in the directory where the Workbooks are.

The tool will take the Template formatting and apply it to all the dashboards it's pointed at.

For the tool to work there are two important aspects to this Workbook:

  • The Workbook is named
    Template.twb
  • The Dashboard is also named
    Template.

Of course, if one wants to use another Workbook and Dashboard name, it's easy to reconfigure the tool to accommodate them.

The formatted Dashboards.

Here are the default and formatted dashboards re-formatted with the Template formatting.

Important points about the formatting:

  • Only the formatting shown above will be applied;
    there are other things one might wish to configure, but there are complications that go along with them.
  • All of the Template Dashboard's formatting will be applied, even if some part of it hasn't been configured;
    it's possible to implement finer-grained control of what formatting gets applied, but that gets complicated, beyond the scope of this initial formatting approach.

The tool: SetDashboardFormatAll.rb
is available on GitHub here, or can be copy/pasted from below.


  #  Copyright (C) 2014, 2015  Chris Gerrard
  #
  #  This program is free software: you can redistribute it and/or modify
  #  it under the terms of the GNU General Public License as published by
  #  the Free Software Foundation, either version 3 of the License, or
  #  (at your option) any later version.
  #
  #  This program is distributed in the hope that it will be useful,
  #  but WITHOUT ANY WARRANTY; without even the implied warranty of
  #  MERCHANTABILITY or FITNESS FOR A PARTICULAR PURPOSE.  See the
  #  GNU General Public License for more details.
  #
  #  You should have received a copy of the GNU General Public License
  #  along with this program.  If not, see <http://www.gnu.org/licenses/>.
  
  require 'twb'
  require 'nokogiri'
  require 'csv'
  
  $templateTwb  = 'Template.twb'
  $templateDash = 'Template'
  $twbAppend    = '_styled_'
  
  puts "\n\n"
  puts " Setting Workbook dashboard formatting, using the formatting"
  puts " from the #{$templateDash} dashboard"
  puts "   in the #{$templateTwb} workbook\n\n"
  
  $csv = CSV.open("TT-FormattedWorkbooks.csv", "w")
  $csv << ["Workbook","Dashboard"]
  
  def loadTemplate
    return 'Template.twb not found' unless File.file?('Template.twb')
    twb  = Twb::Workbook.new('Template.twb')
    dash = twb.dashboards['Template']
    return 'Template dashboard not found' if dash.nil?
    style = dash.node.at_xpath('./style')
    return '  ERROR - no style available from Template dashboard.' if style.nil?
    puts "   Dashboard styling:"
    styleRules = style.xpath('./style-rule')
    if styleRules.empty?
      puts "\n\t  Template dashboard formatting is default style."
    else
      styleRules.each do |rule|
        puts "\n\t Element: #{rule['element']}"
        formats = rule.xpath('./format')
        formats.each do |f|
          puts sprintf("\t -- %-16s : %s \n", f['attr'], f['value'])
        end
      end
    end
    puts "\n"
    return style
  end
  
  def processTwbs
    path = if ARGV.empty? then '*.twb' else ARGV[0] end
    puts " Looking for TWBs using: #{ARGV[0]} \n\n"
    Dir.glob(path) do |fname|
      setTwbStyle(fname) unless fname.eql?($templateTwb) || !fname.end_with?('.twb')
    end
  end
  
  def setTwbStyle fname
    return if fname.eql?($templateTwb) || fname.include?($twbAppend + '.twb')
    twb = Twb::Workbook.new(fname)
    dashes = twb.dashboards.values
    puts sprintf("\t%3d in: '%s' ", dashes.length, fname)
    return if dashes.empty?
    dashes.each do |dash|
      node  = dash.node
      style = node.at_xpath('./style')
      tmpStyle = $templateStyle.clone
      style.replace(tmpStyle)
      $csv << [fname, dash.name]
    end
    twb.writeAppend($twbAppend)
  end
  
  $templateStyle = loadTemplate
  if $templateStyle.class == 'String'.class
    puts "\t #{$templateStyle}\n\n"
  else
    processTwbs
  end
  
  $csv.close unless $csv.nil?

The Tool in action
Here's the code being run.

In this case the execution command specifies that only the single Workbook ExampleDashboards.twb will have its Dashboard(s) formatted.

Upon startup, the tool looks for the Template Workbook and Dashboard and, assuming it finds them, prints out the formatting found there.

It then looks for Workbooks, either all of them, or those matching the single command line parameter. Those that it finds have any Dashboards they contain formatted to the Template configuration.

It then looks for Workbooks, either all of them, or those matching the single command line parameter. Those that it finds are listed with the number of their Dashboards, if any, and have their Dashboards formatted to the Template configuration.

By default, the Template-formatted dashboards are written to a copy of the original, with '._styled_' appended to the name. This is a precaution, ensuring that the original Workbook isn't harmed in the process. Adjusting the Tool to apply the formatting directly to the Workbook is a small change, easily made.


 ...$ ls -1 ExampleDashboards*.twb
 ExampleDashboards.twb

 ...$ ruby "{path to}\SetDashboardFormatAll.rb" ExampleDashboards.twb  


  Setting Workbook dashboard formatting, using the formatting
  from the Template dashboard
    in the Template.twb workbook

    Dashboard styling:

          Element: table
          -- background-color : #fae7c8

          Element: dash-title
          -- font-weight      : normal
          -- color            : #000000
          -- font-size        : 14
          -- background-color : #f0d9b6
          -- border-color     : #b40f1e
          -- border-style     : solid

          Element: dash-subtitle
          -- font-size        : 11
          -- font-weight      : normal
          -- color            : #b40f1e
          -- background-color : #d7d7d7

          Element: dash-text
          -- text-align       : center
          -- color            : #b40f1e
          -- background-color : #e1e8fa
          -- border-color     : #1b1b1b
          -- border-style     : solid
          -- font-family      : Comic Sans MS

  Looking for TWBs using: ExampleDashboards.twb

           2 in: 'ExampleDashboards.twb'

 ...$ ls -1 ExampleDashboards*.twb
 ExampleDashboards._styled_.twb
 ExampleDashboards.twb

 ...$

Friday, June 5, 2015

This changes everything - Autodocumenting Workbooks

Your Workbooks can document themselves, now that programmatically creating and injecting Dashboards that document Workbooks into them is a reality. And it's free.

Consider the Regional Sample Workbook. It has six separate vizzes, but one easily can't tell whether any of them is a Dashboard without visually inspecting it. Nor can we see which Worksheets a Dashboard includes without opening it, and there's no way to tell how all the Dashboards relate to all the Worksheets, or the Worksheets to the Data Sources they access.

Imagine, if you please, what it would look like if there was a way to have the Workbook -> Dashboards -> Worksheets -> Data Sources relationships teased out of the Workbook, rendered graphically, and then added back into the Workbook as a self-documenting Dashboard.

Would you like that? Would it be handy? Useful? Maybe? Until now, this sort of thing has been difficult, awkward, and manually intensive. If it was doable at all.

Not any longer. It's now simple and straightforward, with a minimum of fuss, for one workbook, or a whole boatload of them.

Here it is — the Regional Workbook, autodocumented,
with the map of its Dashboards, Worksheets, and Data Sources automatically generated and injected into it.

Adding documentation to Workbooks, where it really matters, has always been a manual, laborious process, with so much friction that it hasn't been feasible at scale. No more. Tableau Tools' now has the ability to inject dashboards into existing dashboards automatically. Coupled with its existing abilities to generate useful content about Workbooks, this opens entire new horizons for enriching Workbooks with surprisingly little effort.

How the magic happens.

The simple version: run a simple Ruby script in a directory containing Workbooks to be documented, and presto! the Workbook(s) are documented with the desired content; in this case the D->W->DS maps for each.

Run this code in a directory containing Workbooks.
# Copyright (C) 2014, 2015 Chris Gerrard # # This program is free software: you can redistribute it and/or modify # it under the terms of the GNU General Public License as published by # the Free Software Foundation, either version 3 of the License, or # (at your option) any later version. # # This program is distributed in the hope that it will be useful, # but WITHOUT ANY WARRANTY; without even the implied warranty of # MERCHANTABILITY or FITNESS FOR A PARTICULAR PURPOSE. See the # GNU General Public License for more details. # # You should have received a copy of the GNU General Public License # along with this program. If not, see . require 'twb' puts "\n\n\t Documenting Workbooks with Tableau Tools" puts "\n\t Adding Dashboard -> Worksheet -> Data Source graphs" puts "\n\t https://github.com/ChrisGerrard/Tableau-Tools" puts "\n" path = if ARGV.empty? then '*.twb' else ARGV[0] end puts "\n\t Files matching: '#{path}'" Dir.glob(path) do |twb| puts "\t -- #{twb}" twb = Twb::Workbook.new(twb) dotBuilder = Twb::Util::TwbDashSheetDataDotBuilder.new(twb) dotFile = dotBuilder.dotFileName renderer = Twb::Util::DotFileRenderer.new imageFile = renderer.render(dotFile,'png') dash = Twb::DocDashboardImageVert.new dash.image=(imageFile) dash.title=('Dashboards, Worksheets, and Data Sources') twb.addDocDashboard(dash) twb.writeAppend('dot') end

The code is available on GitHub here.
Not much to it, is there?
Tableau Tools does the work, needing only a little glue code to compose the specific functionality.

Here's the code running in a directory containing Tableau Sample Workbooks.

As the code runs it picks up all the *.twb files in the directory and processes each in turn.


  Dir.glob(path) do |twb|
  puts "\t -- #{twb}"
  twb        = Twb::Workbook.new(twb)

Each file has its D->W->DS map built with:


  dotBuilder = Twb::Util::TwbDashSheetDataDotBuilder.new(twb)
  dotFile    = dotBuilder.dotFileName
  renderer   = Twb::Util::DotFileRenderer.new

The D->W->DS map image file is added to a Dashboard which is then injected into the Workbook with:


  dash       = Twb::DocDashboardImageVert.new
  dash.image=(imageFile)
  dash.title=('Dashboards, Worksheets, and Data Sources')
  twb.addDocDashboard(dash)

The Workbook is written out, as a copy with '.dot' added to its name with:


  twb.writeAppend('dot')

There's no technical reason to create a new copy of the Workbook, and in a production environment the Workbooks are mostly documented in place, i.e. keeping their own names.

Dependencies

Ruby 1.9.3
is preferred, almost exclusively because the Nokogiri gem that's required under the covers works seamlessly with 1.9.3 (on Windows), and not so seamlessly with Ruby 2.x. See the Nokogiri section below for more information.


The Twb gem
is required, and is declared as such via "require 'twb'", the first executable (non-comment) line.
The gem is installable via "...> gem install twb", which assumes that "gem " is installed, which should have happened when Ruby was installed.


 ... Tableau Sample Workbooks> gem install twb
 Successfully installed twb-0.3.2
 1 gem installed
 Installing ri documentation for twb-0.3.2...
 Installing RDoc documentation for twb-0.3.2...

 ... Tableau Sample Workbooks> gem list twb

 *** LOCAL GEMS ***

 twb (0.3.2)

 ... Tableau Sample Workbooks> 

(post-publishing) note:
The correct gem version is 0.3.2 (as of this writing) – there was a glitch in the gem publishing that I didn't catch at the time of the original post resulting in an obsolete version of it being installed.
Thanks to Philip, Vishwanath, and Matthew for reporting this.


The Nokogiri gem
Nokogiri is an XML and HTML parsing gem that's used by the Twb gem. If it's not installed the 'require' statement in Twb will fail.
Nokogiri is installable thus:


 ... Tableau Sample Workbooks> gem install nokogiri
 Fetching: mini_portile-0.6.2.gem (100%)
 Fetching: nokogiri-1.6.6.2-x86-mingw32.gem (100%)
 Nokogiri is built with the packaged libraries: libxml2-2.9.2, libxslt-1.1.28, zlib-1.2.8, libiconv-1.14.
 Successfully installed mini_portile-0.6.2
 Successfully installed nokogiri-1.6.6.2-x86-mingw32
 2 gems installed
 Installing ri documentation for mini_portile-0.6.2...
 Installing ri documentation for nokogiri-1.6.6.2-x86-mingw32...
 Installing RDoc documentation for mini_portile-0.6.2...
 Installing RDoc documentation for nokogiri-1.6.6.2-x86-mingw32...

 ... Tableau Sample Workbooks> 

note:
Nokogiri is sensitive to the Ruby version being used.
I'm using Ruby 1.9.3, mostly because: it's stable; suitable for my purposes; inertia; and Nokogiri didn't work with 2.x Ruby in the limited testing I did.
There's some documentation online about Nokogiri and Ruby 2.x but I've not had the time to puzzle out how to get them to play nice together.


Graphviz
The diagrams are created using Graphviz - open source graphing software, which can be downloaded and installed from here.

Graphviz location In order for the graphs to be rendered, Graphviz needs to be available for use by the Twb Twb::Util::DotFileRenderer object, which assumes the default Graphviz installation: 'C:\tech\graphviz\Graphviz2.38\bin\dot.exe'.
'dot.exe' is the Graphviz program that renders this particular graph type—there are many other types, each with their specific rendering program.

If Graphviz is installed into another directory, it can be communicated to the Twb rendered by adding the following line to the code (new line bold):


  renderer   = Twb::Util::DotFileRenderer.new
  renderer.gvDotLocation=('dot.exe location') 


To infinity, and beyond.

With the Workbook injecting nut cracked, there's no end to the things that can be done. Whatever can be thought up can be created and added to your Workbooks.

But wait, there's more.

Workbook autodocumenting relies upon Tableau Tools' ability to modify and write Workbooks. This core feature makes it possible to compose functionality to accomplish pretty much anything you could want to do with and to your Workbooks. The door is open, the future beckons, and it going to be a fun ride.

About Tableau Tools

Tableau Tools is open source software for interrogating and manipulating Tableau Workbooks and other artifacts. It has two main parts as of this writing:

  • The TWB Ruby gem, available on Github at: https://github.com/ChrisGerrard/TWB, is the core element. It models Workbooks and their major components, allowing for easy access to and control of them. Based on Nokogiri, it provides the opportunity to employ Nokogiri when access and manipulation of deeper components for specific uses is needed.
  • The Tableau Tools project, also available on GitHub: https://github.com/ChrisGerrard/Tableau-Tools contains tools for Tableau assessment and manipulation, including all manner of useful tools that can be composed into richly functional suites with minimal fuss and bother.

Tuesday, May 12, 2015

Need to know your Custom SQL? Use the new Tableau Tool - ExtractCustomSQL.rb

ExtractCustomSQL.rb

Will scan your Workbooks and TDS files, searching out, extracting, and recording the Custom SQL they contain.

It's available on GitHub here.

It's Tableau Tools wiki page is here, providing the basic information about it.

There's not much in the way of visuals to show for this tool. The Tableau Sample Workbooks don't use Custom SQL, and most of the Custom SQL in my usual Tableau archive isn't something that can be released into the wild.

Tableau Wasted?

It's not development, dagnabbit.

I've been working with this client for several weeks. They've bought into Tableau as a really good and valuable thing, and are moving ahead like gangbusters. Tableau Desktop licenses are being distributed like Hallowe'en lollipops. Things are happening, people are excited and engaged. We're building out the Tableau Server environments, putting 9.0.1 into production this weekend.

It's a good, robust environment, where people are taking advantage of Tableau to help improve their data sense-making abilities. Everything's good.

Or is it?

This came in an email today from someone who's been involved with Tableau for a while and recently received a Desktop Tableau license:

"Do you need a different license to do Tableau development? Or is the desktop license what you need?"

Whoa, mule!

This is alarming. This little piece of information is highly revealing, it reinforces one of my suspicions; that overall, even though the company is rapidly adopting Tableau as if it was the best and greatest thing to come down the pike (and it is), they really don't have any idea what it's about and are missing the big point, and along with it the opportunity to take advantage of most of Tableau's value.

Here's my reply to the email:

It’s actually more helpful to think of working with Tableau as authoring rather than as development.

In traditional software development the “development” activity is at the tail end of the production process, largely divorced from the real analytical work of coming up with the valuable outcome: analyses that reveal and communicate information. Development is the technical implementation of someone else’s ideas.

Tableau provides the opportunity for one to work at the creative intersection of cognitive, intellectual, and experiential factors that, when working in harmony, can synthesize the information needs of the person seeking to understand the data and the immediacy of direct data analysis. This mode of Tableau use can eliminate the lags and friction involved when there are multiple people between the person who needs to understand the data and the person who creates the vehicle for delivering the information from which insights are gleaned.

It –is– possible to use Tableau as a traditional development tool, one that enables technicians to develop dashboards and other analytics faster than with many other technologies. And this use has a valuable place in the overall data analytical environment, but limiting Tableau to this role, or even employing it predominantly in this way, misses the great bulk of the opportunities Tableau provides to help people understand their data with a minimum of fuss and bother.

When someone works with Tableau to explore and understand their data, or in intimate collaboration with the information-seeker, Tableau use becomes a dynamic, creative, cognitive and intellectual exercise, and the creation of analyses that reveal and communicate valuable information and insights is an act of authorship.

Helping people and organizations take advantage of what Tableau offers is a very satisfying way to earn a living. But it's not without its speed bumps and detours. History and experience are very sticky and persistent. Sometimes helping clients recognize that there are new ways of thinking about the world, of the possibilities that exist, the new ways of doing things, can be a bigger challenge than is obvious at the start of the relationship. Fortunately, most people aren't unwilling to get better results quicker, easier, and with less cost, but it can take time and familiarization for the possibility to be recognized.

I love my work.

Monday, May 11, 2015

New Tableau Tool - Extract and Record Field Comments

It was a dark and lazy evening. Nothing much happening. Then things got Interesting. Inspiration knocked on the door, and without waiting for Invitation walked right in.

Seems that Tableau's been keeping some information to itself: comments. Comments about Fields. Information that could, in the right hands prove very useful, even valuable. Inspiration wanted me to come up with a way to get Tableau to give up its comments, and who can resist Inspiration?

The thing is, Tableau doesn't give up its secrets easily. Sure, you can open up a Workbook, then a Worksheet, pick a Data Source, right-click on a Field, navigate down into its menu items and convince it to fess up, spill the beans, give up the goods, sing. But this isn't efficient, and it makes is hard to get the whole story, the straight dope, the full shenanigan. Looking as isolated comments is no way to build a comprehensive integrated overview of the entire metadata landscape.

It didn't take much coaxing; I always was a sucker for an insistent Inspiration. So I pulled out my trusty Twb gem and whipped up a brand spanking new Tableau Tool—ExtractFieldComments.rb, custom crafted to scan a set of Workbooks and locate and record the comments for all the fields that have them. Didn't take long, I was eager to get back to finding out what Inspiration had in store for me next.

Get it here
at Tableau Tools on GitHub: https://github.com/ChrisGerrard/Tableau-Tools/blob/master/Ruby/ExtractFieldComments.rb

ExtractFieldComments.rb in action.

Here's what it looks like when it's run in a directory containing the Tableau Sample Workbooks from versions 8 and 9:

As we see, ExtractFieldComments.rb walks through the Workbooks. While it doing so it's showing the different Data Sources as they're encountered. It's not showing the Fields as they're examined–doing so would produce too much output with too little information–but it's recording all the Fields that have comments, along with those comments into the CSV file TT-FieldComments.csv.

Being a CSV file, TT-FieldComments.csv can easily be opened and analyzed with Tableau. Which is, after all the point.

Understanding the Comments

This Tableau Public published Workbook provides a sampling of the ways in which the comments for your Workbooks can be collected, organized, analyzed, and understood. And all comments want to be understood. One of my mentors was fond of saying: "There aren't any bad comments, just some that are misunderstood."

What's next?

There are plenty of additional Tableau Tools in the pipeline. Many of them are versions of scripts I've published here reworked to take advantage of the Twb gem. Some of them are brand spanking new. I'd really like to hear any ideas from the community about useful tools. And I'd really like it if anyone else want to take a stab at building your own Tableau Tools — that's what the project's all about.

Monday, May 4, 2015

New Tableau Tool – Reset Field Names

This tool was prompted by this Tableau community forum discussion: In 8.2 - how do I stop Tableau from renaming all my fields?

The person who posted the original discussion was complaining that Tableau was automatically renaming the fields upon first connection to the data, e.g. the field was_this_visit_callable was renamed Was This Visit Callable.

The behavior was introduced in Tableau 8.1 (per Tableau support via Tom W).

It's not unreasonable to think that renaming fields from their technical names to user-friendly names has value, particularly in those environments where the database people don't want to, or can't, give human-oriented names to the database fields. But there are circumstances where it's not appropriate and when done forces people to either live with field names they'd prefer not to have, or exert the time, energy, and effort to undo the changes Tableau automagically made.

Adjusting field names to make them more human-oriented isn't in itself a bad thing, but Tableau's implementation of the feature is lacking in several important ways, including:

  • it happens invisibly—Tableau changes the names without informing the person who connected to the data that it's done so;
  • it's an imposed functionality without an opt-out ability—there's no mechanism whereby the User can choose for this to happen, or not;
  • there's no way to control the adjustments that Tableau makes, which are (at least, and in this order)
    • replacing underscores '_' with blanks '  '
    • upper-casing the first letter of each discrete word

We can't fix Tableau but we can fix the names.

ResetFieldNames.rb
is a Tableau Tool that will find all of the renamed fields in your workbooks and remove the customized names, leaving the database names as the ones the User sees.

About ResetFieldNames.rb:
  • It's written in Ruby and is available from GitHub here.
  • It uses the Twb Ruby gem, available via RubyGems.
  • It's surprisingly small, only 34 functional (not comments) lines.
  • Is run from the command line:
    ruby ResetFieldNames.rb
  • Will reset the field names in selected Workbooks:
    • by default – all of the Workbooks in the current directory;
    • the Workbooks can be identified on the command line, e.g.:
      ruby ResetFieldNames.rb 'some*.twb'
      using file patterns to identify groups of fields.
  • Will not reset Calculated field names; although they have technical and User names, they aren't database fields and their technical names are undecipherable for normal humans.
  • By default writes the reset fields to a copy of the original Workbook with '.reset' appended to the Workbook's name, e.g.
    Science.twb -> Science.reset.twb
    this can be changed so that the Workbook will be replaced when written, or other text can be provided for appending.
  • The reset fields will be recorded in the CSV ResetFields.csv with the fields:
    Workbook,Data Connection,Field Name,Field Caption
    making it easy to determine which fields were changed, in which Workbooks.

Considerations and potential enhancements.

Indiscriminate
ResetFieldNames resets all the fields to their database names. It would be really helpful if the fields could be selectively reset, making it easier to get them configured just right. There are many ways to accomplish this, one easiest and most transparent method would be to use an Excel/CSV file as the input identifying the field names to reset.

Considerations and potential enhancements.

Please add your comments here, or to ResetFieldNames.rb's Tableau Tools wiki page on GitHub


I hope you find this Tableau Tool useful and valuable.

Monday, April 27, 2015

Dear Mr. or Ms. Recruiter

I get calls all the time from recruiters wanting to know if I'm interested in this or that Tableau job. Most often it involves the opportunity to go and be a Tableau developer somewhere. It's even possible to triangulate which company is moving forward with their Tableau efforts from the three very similar calls I get within a 24 hour period. They go like this:

Ring, Ring
me: Hello

them: Hello, I'd like to speak to Chris, please.

me: That's me.

them: Hello, Chris. My name is Lotso Letters, how are you today.

me: I've very well, how are your?

them: I'm very well Chris thankyouforasking.
Chris, I'm calling because there is an opportunity for a Tableau developer and can I submit you for the position and how little will you work for?

me: To tell the truth, I'm probably not interested, but if it's a truly exceptional opportunity I may be.
What are the particulars?

them: SDLC, process, development, build dashboards, support Tableau Server, etc.

them: How much is your rate?

me: My rate is $X
...
...

them: Let me talk to my manager and see if the client is willing to pay that.

At which point the conversation is essentially dead.

I can appreciate that people are trying to make money off of the commoditization of my profession, and it's been coming for a long time, but it still stings that Tableau is being misused to the degree that it is.

So when I received another missive from someone wanting to know if I was interested in a Tableau developer position, I wrote the following.

Hello {name}. Thanks for your note, but I'm not interested in being a developer of any kind.

I've been doing business data analysis for a long, long time, and I'm firmly convinced that the idea that satisfying business needs for information from data is an activity that ends up with someone developing something someone else thought up in response to someone else's thoughts about what yet another person needs, in the traditional SDLC paradigm, is just flat wrong.

My career started with establishing direct intimate relationships with business people, using 4GLs to create the reports they needed. Without developers (COBOL programmers in those days). I was lucky enough to get to work for the leading 4GL software vendor, for managers who knew that business consulting is more important than technical contracting. We got to go to work every single day and deliver the information people needed without layers and layers of people and technology getting in the way.

That world faded into obscurity with the advent of Big BI, where building massive data cathedrals became the point. But it's coming back, and Tableau is leading way. In Fact, a very good argument can be made that the good world is coming back because of Tableau's leadership in demonstrating that it's possible.

As a Tableau consulting practice manager, and an avid and enthusiastic Tableau devotee since 2006, I get to go to work and help my clients move away from the analysis/design/develop/test/deliver SDLC-based paradigm that at best delivers a very thin slice of the universe of possibilities, and generally does more harm than good. (but it does line the pockets of the traditional Big BI contracting firms who are getting better at "re-purposing" traditional BI people into their clients' organizations as Tableau developers.

Although the world is moving in the right directing of bridging, even eliminating the gap between people and the data they need to understand, there are very powerful, very conservative forces, that are trying to maintain the bad old ways and keep as many thumbs in the pie as possible. To the degree they succeed in impeding, co-opting, blunting, or otherwise diminishing the possibilities that Tableau (and its cousins, including those not yet born) brings, they'll make more money even as they fail deliver nearly the value the organization should be receiving.

If you're clients are interested in truly taking advantage of the full spectrum of opportunities and possibilities Tableau offers I'd be happy to talk to them and see how I can help. Otherwise, thanks again for your note, but I'm not interested in helping companies do the wrong thing.

Wonder if they'll keep calling.

Sunday, April 26, 2015

Fast, Easy, Free Workbook Documentation and Management with the TWB Gem

Finally.
After years of asking Tableau to implement mechanisms for documenting Workbooks in the Workbooks, and for automated ways to manage Workbook and their contents the wait is over.

We have the technology
to build apps that can access, interrogate, and manipulate Tableau Workbooks in ways that haven't previously been possible. And the technology is free, as in speech and beer.

Up until now

there have been ways to document your Workbooks, including:

and to manage them, e.g.

  • Ruby scripts I've published here (free)
  • Ruby scripts I've created for clients (unavailable to the public)
  • Interwork's tools ($$$)
  • others (?)

TWIS and The Workbook Auditor have been around for a number of years, and provide useful and valuable information about the workbooks they're asked to look at. Andy's Auditor is very polished, with good coverage, and works very well for most people. TWIS is more of working tool that goes pretty deep, uncovering lots of rich detail, e.g. field calculations, and still works well but it's a monolithic Java app. I've taken a different tack, which has led to this post and am not planning on maintaining TWIS.

I'm a bit familiar with Interwork's tools, but haven't had much use for them as I build apps that cover my needs, and can quickly create new ones on demand. And their tools are expensive.

The existing solutions are deficient
for a number of reasons.

There's a mismatch between the nature of the information in Workbooks and Tableau's structural model of analyzable data.

  • Workbooks are complex multi-segmented, deep XML files with cross-links between the branches, with many individual paths, most of which can be only partially populated.
  • Tableau is limited to accessing flat, two-dimensional tabular data. It has no concept of higher-level structures, even something as simple as a two-level master-detail hierarchy, as is discussed here. Further, Tableau shows no sign of recognizing the existence of these structures, or of the value of enabling their transparent analysis. Sadly, we had tools that could do this thirty years ago.

In building TWIS it became clear that any single app that was able to capture the multitude of two-dimensional slices through Tableau workbooks becomes very, very complex very quickly. Building one app to pull all of the interesting data about workbooks out of the them became the chase of a rapidly receding horizon, a pursuit one person, at least this person, couldn't keep up in the long run.

On top of this, the analyses and documentation generated by these approaches is external to the Tableau Workbooks themselves. As a result, there's a lot of friction in using them — one needs to run the tool and examine the documentation separately from Tableau. This is a suprisingly large hurdle to helping people understand their individual workbooks, which is what most people are concerned with.


A better way.

Several years ago I began writing simple, straightforward Ruby programs to access, analyze, and manipulate Workbooks according to the specific needs at that time. These were rooted in the experience gained from creating TWIS, proved to be good solutions for those cases TWIS didn't cover. Some of them I've published here, many others I haven't.

The TWB Ruby gem.

After writing lots of these Ruby apps, and writing the same boilerplate code multiple times I decided to create a library that models Workbooks and their components. Being Ruby, it was natural to create this as a Ruby gem, and so Twb, the gem, was born. My hope and ambition is that the Twb gem can and will be used by others to create apps to access, interrogate, and manipulate Workbooks.

Twb on RubyGems.org – ready for use.
Twb is freely available from RubyGems.org. Just like any other Ruby gem, it's easy to install and start using. Assuming that you have Ruby and RubyGems installed on your computer, installing Twb is this simple (in Windows):

That's about as simple as can be. One of the attractions of using Ruby is its emphasis on making things simple, easy and straightforward, with a minimum of fuss and bother.


Twb in use.

Once installed, Twb can be used to make writing useful and valuable apps simple and straightforward. Or at least as simple as what you're trying to do can be—the things one wishes to know about and do with Workbooks are as complex as the information models of the Workbook elements one's interested in, and what one wants to do with them. Twb's ambition is to make these apps easy to create and transparent to use.


What Versions are your Workbooks?

At the simple end of the spectrum is a simple app that scans a set of Workbooks and reports the Version and Build information for each. Version and Build are related to the Tableau version last used to save the Workbook. Build is the technical release number that is also available in Tableau's "Help | About" menu option. Version is loosely but not strictly tied to the Tableau version – 8.2, 8.3, 9.0, etc. – I've not puzzled out the real relationship, largely because I've not had the real need to.

WorkbookVersion.rb

This Ruby script is available online from Github here.


#  Copyright (C) 2014, 2015  Chris Gerrard
#  (GNU General Public License v3 notice here)

require 'twb'

puts "Identifying the Version and Build of these Workbooks:"

$csv = File.open("WorkbookVersion.csv", "w")
$csv << "Workbook,Version,Build\n"

path = if ARGV.empty? then '*.twb' else ARGV[0] end
Dir.glob(path) do |fname|
  twb = Twb::Workbook.new(fname)
  puts sprintf("  %-20s %5s  %s", twb.name, twb.version, twb.build)
  $csv.puts "#{twb.name},#{twb.version},#{twb.build}"
end

When run, the script scans for Workbooks and upon finding some does two things with each:

  • Prints the Workbook's Name, Version, and Build to the console.
  • Creates a CSV record in the file "WorkbookVersion.csv" containing the Name, Version, and Build.

This is accomplished with only 10 lines of Ruby code, leveraging Twb to handle the heavy Workbook-parsing lifting.

Here's the script in use, in a directory containing the Sample Workbooks from Tableau versions 8.3 and 9.0:

This Tableau Public Dashboard shows a viz of the CSV file generated above.

It's an example of the sort of analysis that can be achieved with TWIS, The Workbook Auditor, etc.

The Twb gem doesn't really do anything new here, but it does make doing exactly the thing you need done easy.

WorkbookVersion.rb can be instructed to scan specific Workbooks by passing the file name pattern on the command line, e.g.:

  • WorkbookVersion.rb 1.twb
    — will only scan the single workbook Science.twb
  • WorkbookVersion.rb '**/*.twb'
    — will scan all of the Workbooks in the current directory, and in all subdirectories.

Running WorkbookVersion.rb in a directory containing all of your Workbooks makes it very easy to see which Tableau versions created how many of them, and which ones, by building a couple of very simple vizzes.


What's next? We're just getting started.

I've already used Twb to create a wide variety of apps, which I'll be publishing them here, and their source code to Github, in future posts. Some of them are brand new, some of them are existing apps re-implemented to take advantage of Twb. I hope they're all useful.


The Grand Ambition.

My intention is to create a vibrant ecosystem of tools for managing Tableau workbooks, and hope that it's a fertile ground for the nurturing a community that uses and advances the tools.

Twb and the Tableau Tools will be released as Open Source projects, as soon as I can get the ducks in a row.

Everybody's welcome.

No matter what your level of experience with Tableau, Ruby, workbook XML munging, open source projects, etc., the Twb gem and related apps are available for your use, and hopefully contribution. Please feel free to join in.

Let the fun begin.