Tuesday, September 16, 2014

Poof! Go the Permissions

Permissions continue to present mysteries and surprises. I recently came across this interesting situation: in the process of configuring the Project Permissions for a particular group it up and disappeared from the Permissions page.

The Tableau Public workbook below shows what happened. Follow the dashboards #1-#4.

Thursday, September 11, 2014

Tableau is digital photography in a film world redux.

Christian Chabot, in his TC 2014 keynote, likened Tableau to digital photography vs traditional business data analysis' film.

It's an excellent metaphor, capturing the essence of how Tableau transforms the nature of the relationship between people and the data that matters to them.

I'm glad I was able to help.

The original post, March 19, 2013

Linked in "Best of the Tableau Web...", March 27, 2013

Echoed by Tom Brown, The Information Lab,Oct 28, 2013

My Excellent Tableau Conference Adventure (so far)

It was an inspirational day at TC 2014. Better than I expected, or deserved.

I sat in on Jonathan Drummey's "Extreme Data Blending" session, and was amazed at the depths he's plumbed in ferreting out the mysteries of how data blending works. Even better was the clarity of his presentation, making the complex and esoteric seem familiar and graspable. I'm now much better equipped to employ data blending to good effect than I was a day ago.

Sadly, I missed Joe Mako's "Flowing With Tableau" session. Although I got there 20 minutes or more before it was to start the line was already far longer than would get into the room, and many people were left bereft. This was a disappointment, as Joe's and Jonathan's sessions were the two I most wanted to attend. I remember the first Joe Mako session I went to, some years ago, to see this fellow I felt I knew from his Tableau forum support. After the session I went up an introduced myself, feeling like a little boy meeting Wayne Gretzky (I'm Canadian), and to my surprise Joe was a friendly in person as he was online.

I also had the great pleasure of meeting Richard Leeke, whose mapping work I've been borrowing for a long time, and Noah Salvaterra, who's blazed across the Tableau firmament creating astonishingly beautiful and illustrative works with Tableau that almost seem impossible, or at least dark magic.

At one point I was in the company of these four, and Zen Master Ramon Martinez, whom I had the pleasure of working with at the Pan American Health Organization some time ago. I felt a little bit of an interloper, hugely lucky, and something of a fanboy in the company of the smartest, most clever, and most generous members of the Tableau community.

It's easy to get lulled into the day to day routine. When your work is steady state, and constant, there's the tendency to become comfortable with the familiar, and the allure of the interesting puzzles to gnaw on dims. After this conference, after seeing the remarkable things I seen people do, people whom I have the utmost respect for, I'm energized again and looking forward to pursuing new and interesting avenues. There's a lot of Tableau left to cover, and there's no time to waste.

Monday, September 8, 2014

Do you know what your Calculated Fields are?

or, Is my 'Profit' the same as your 'Profit'?

It's helpful to be able to identify what fields are being calculated in Tableau. From an enterprise governance perspective it's essential.

Unfortunately Tableau doesn't provide this information except through manual inspection of the fields' calculations in the calculation dialog. This is a serious deficiency, one that hinders Tableau's adoption in the Enterprise, where senior management is reluctant to let Tableau loose "in the wild" for fear of having dueling metrics without transparency.

Fortunately, there's an easy solution. This post presents a simple Ruby script I whipped up that examines Tableau workbooks and creates a CSV file containing the relevant information about the calculated fields. This CSV file is then usable with Tableau to provide the transparency necessary to tell whether or not two metrics are in fact the same.

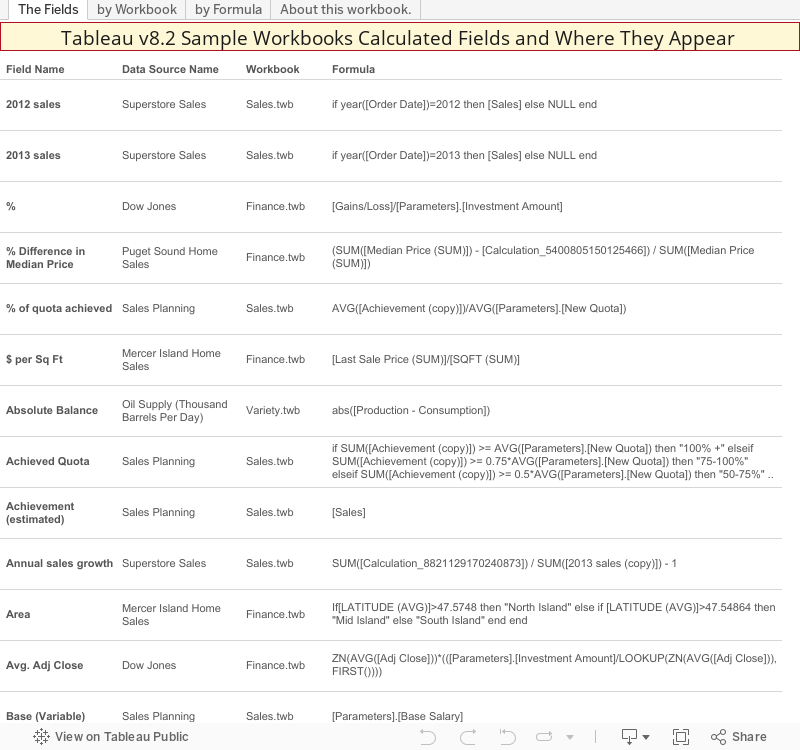
Example: the Tableau Sample Workbooks' Calculated Fields

As an illustration of somewhat real world calculated fields, here are those found in the Tableau v8.2 sample workbooks. They range from simple to reasonably complex.

Introducing TTC_CalculatedFields.rb

Here's how it works in the simplest case: you copy/paste the code below into file named oh, say "TTC_CalculatedFields.rb" — it's then a bona fide Ruby script. Then from a command prompt run it in from the directory containing the TBWs you want the calculated fields from.

The usual way to run it is with

"{pathtoRuby}\Ruby" TTC_CalculatedFields.rb

It will then find all of the TWBs in the directory, and all the sub-directories, and record all of their calculated fields.

The usual caveats apply.

  • You need to have Ruby and the nokogiri and open-uri gems installed for it to work. This is very simple and straightforward, and most organizations have someone who's already using Ruby to help if you need it.
  • It only examines TWBs, not packaged workbooks. It's mechanically not difficult to add the functionality but it introduces complexities in handling name collisions and I wanted to keep it simple but useful.
  • There are technical properties of calculated fields that are meaningful to deeper analysis but don't mean much on the surface.
  • Groups are a specialized calculated field, but their internal structure is very different from the other types, making it difficult to add them to the properties/fields of the other classes. I decided not to force them so they show without formulae - this is a fairly common problem in analyzing Tableau workbooks and other hierarchical and network data structures, and Tableau isn't designed to support analysis of data like this.
  • It carries no warranty or guarantees that it'll work.

On the other hand, it should be pretty easy to address any shortcomings it has. Ruby is an elegant language that makes fixing and improving things generally simple and straightforward.


# TTC_CalculatedFields.rb - this Ruby script Copyright 2013, 2014 Christopher Gerrard require 'nokogiri' require 'open-uri' $recNum = 0 $CSVHeader = <<CSVHEADER.gsub("\n",'') Record Number, Workbook, Workbook Dir, Data Source Name, Data Source Caption, Data Source Name (tech), Name, Caption, Name (tech), Data Type, Role, Type, Class, Scope Isolation, Formula Code, Formula, Formula Comments CSVHEADER def init $f = File.open("TTC_CalculatedFields.csv",'w') $f.puts $CSVHeader unless $f.nil? end def parseCalculatedFields twbWithDir twb = File.basename(twbWithDir) twbDir = File.dirname(File.expand_path(twbWithDir)) puts "Found '#{twb}' in #{twbDir}" doc = Nokogiri::XML(open(twb)) calculationNodes = doc.xpath("//workbook/datasources/datasource/column/calculation").to_a calculationNodes.each do |d| #-- Data Source -- dsTechName = d.xpath('../../@name').text dsCaption = d.xpath('../../@caption').text dsName = if dsCaption == '' then dsTechName else dsCaption end #-- Field -- caption, = d.xpath('../@caption').text techName = d.xpath('../@name').text name = if caption == '' then getName(techName) else caption end dataType = d.xpath('../@datatype').text role = d.xpath('../@role').text type = d.xpath('../@type').text #-- Formula -- formulaCode = d.xpath('./@formula').text.gsub(/\r\n/, ' ') formulaLines = d.xpath('./@formula').text.split(/\r\n/) formula = getFormula( formulaLines ) comments = getComments( formulaLines ) fClass = d.xpath('./@class').text scopeIsolation = d.xpath('./@scope-isolation').text #-- emit CSV putCSV(twb, twbDir, dsName, dsCaption, dsTechName, name, caption, techName, dataType, role, type, fClass, scopeIsolation, formulaCode, formula, comments ) end end def getName techName techName.gsub(/^\[/,'').gsub(/\]$/,'') end def getFormula lines formula = '' lines.each do |line| line.strip formula += ' ' + line unless line =~ /[ ]*\/\// end return formula.strip end def getComments lines comments = '' lines.each do |line| line.strip comments += ' ' + line.strip if line.start_with?('//') end return comments.strip end def putCSV(twb, twbDir, dsName, dsCaption, dsTechName, name, caption, techName, dataType, role, type, fClass, scopeIsolation, formulaCode, formula, comments ) $recNum += 1 csvLine = <<CSV.gsub("\n",'') "#{$recNum}", "#{twb.gsub('"','""')}", "#{twbDir.gsub('"','""')}", "#{dsName.gsub('"','""')}", "#{dsCaption.gsub('"','""')}", "#{dsTechName.gsub('"','""')}", "#{name.gsub('"','""')}", "#{caption.gsub('"','""')}", "#{techName.gsub('"','""')}", "#{dataType.gsub('"','""')}", "#{role.gsub('"','""')}", "#{type.gsub('"','""')}", "#{fClass.gsub('"','""')}", "#{scopeIsolation.gsub('"','""')}", "#{formulaCode.gsub('"','""')}", "#{formula.gsub('"','""')}", "#{comments.gsub('"','""')}" CSV $f.puts csvLine unless $f.nil? end init Dir.glob("**/*.twb") {|twb| parseCalculatedFields twb } $f.close unless $f.nil?

An interesting exercise would be to round up the various workbooks that have been published about Table Calculations to see what that population looks like. Maybe something to do during the conference this week.


I hope you find this little utility useful. If so, please leave a comment. If it doesn't work, please leave a comment — I may or may not be able to help (time, other demands upon, etc.). If you extend it in some useful way, please leave a comment.

Or just leave a comment.

Thursday, September 4, 2014

A Better Tableau Server Permissions Resolution Explanation

image/svg+xml http://onlinehelp.tableausoftware.com/current/server/en-us/help.htm#license_permissions_backgrnd.htm When resolving the permissions in place for a Dashboard or Worksheet (both are 'views'), the object used to evaluate the permissions is either the view or the Workbook the view is contained in. So, when when evaluating the Permissions for a View this is the first step: Yes No Was the Workbook published showing sheets as tabs? Workbook View's Once the source of Permissions has been determined, this process resolves whether or not the User is granted the Permission: Also see: use the Permissions of the use the the view is in How Tableau Server Resolves Permissions At Runtime else if the User is in a Group for which the Permission is Deny then Deny else Deny "Not granted by any permission for..." the Permission is configured for the User If as configured then Deny or Allow else if the User is in a Group for which the Permission is Allow then Allow The evaluation here is acrossALL the Groups for which the User is a member,if the Permission is Deny for anyof them the User's Permission is Deny. Only if none of the User's Groups'Permissions is 'Deny' is the checkfor 'Allow' made. If a Permission is set directlyfor a User, it doesn't matter ifthe Permission is also set forany Group that the User is a member of. the Permission has not been configured, so it's Denied and is shown by Tableau Server with this message. What happened to? Roles Roles are prominent in Tableau Serverand Tableau's documentation, but asimplemented and presented by Tableau Serverthey are more of a hinderance to understandinghow Permissions work than they're worth.There are too many problems to document here.Look for an in depth ctitique at Tableau Friction.If the ability to create and manage true custom Roles existed they could be useful. Inherited "Inherited" is an unfortunate name."Not configured here" is better.As shown above, if a Permission is not specificallyconfigured as "Allow" or "Deny", it defaults to "Deny"and there's no need to consider "Inherited".Semantically, "Inherited" is a problem because itindicates a positive situation where one does notnecessarily exist, leading to a cognitive conflict inthe person trying to interpret the actual Permissionstate. Not recognizing this situationis a common source of frustration when trying to puzzle out why a User'saccess and abilities to aDashboard (or worksheet)aren't what they're expectedto be. Yes Permissions Permissions are associated with Projects, Workbooks, Dashboards, Worksheets, and Data Sources. Which Permissions are evaluated when assessing User capabilities? Whenever a User accesses Tableau Server that User's Permissions are evaluated by Tableau Serverto determine which objects the User can see, and what s/he can do with them.Tableau Server does this by evaluating the Permissions configured for the diferent objects vis-a-visthe User, either associated directly to the User or to Group(s) the User is a member of. This seems like a straightforward situation - the object's Permissions should be used, but it's not that simple.For Projects, Workbooks, and Data Sources, their configured Permissions are used.But for Dashboards and Worksheets, it depends... This is not clear in Tableau's documentation: Copyright (c) 2009, 2014 Chris Gerrard http://onlinehelp.tableausoftware.com/current/server/en-us/help.htm#license_permissions_backgrnd.htm When resolving the permissions in place for a Dashboard or Worksheet (both are 'views'), the object used to evaluate the permissions is either the view or the Workbook the view is contained in. So, when when evaluating the Permissions for a View this is the first step: Yes No Was the Workbook published showing sheets as tabs? Workbook View's Once the source of Permissions has been determined, this process resolves whether or not the User is granted the Permission: Also see: use the Permissions of the use the the view is in How Tableau Server Resolves Permissions At Runtime else if the User is in a Group for which the Permission is Deny then Deny else Deny "Not granted by any permission for..." the Permission is configured for the User If as configured then Deny or Allow else if the User is in a Group for which the Permission is Allow then Allow The evaluation here is acrossALL the Groups for which the User is a member,if the Permission is Deny for anyof them the User's Permission is Deny. Only if none of the User's Groups'Permissions is 'Deny' is the checkfor 'Allow' made. If a Permission is set directlyfor a User, it doesn't matter ifthe Permission is also set forany Group that the User is a member of. the Permission has not been configured, so it's Denied and is shown by Tableau Server with this message. What happened to? Roles Roles are prominent in Tableau Serverand Tableau's documentation, but asimplemented and presented by Tableau Serverthey are more of a hinderance to understandinghow Permissions work than they're worth.There are too many problems to document here.Look for an in depth ctitique at Tableau Friction.If the ability to create and manage true custom Roles existed they could be useful. Inherited "Inherited" is an unfortunate name."Not configured here" is better.As shown above, if a Permission is not specificallyconfigured as "Allow" or "Deny", it defaults to "Deny"and there's no need to consider "Inherited".Semantically, "Inherited" is a problem because itindicates a positive situation where one does notnecessarily exist, leading to a cognitive conflict inthe person trying to interpret the actual Permissionstate. Not recognizing this situationis a common source of frustration when trying to puzzle out why a User'saccess and abilities to aDashboard (or worksheet)aren't what they're expectedto be. Yes Permissions Permissions are associated with Projects, Workbooks, Dashboards, Worksheets, and Data Sources. Which Permissions are evaluated when assessing User capabilities? Whenever a User accesses Tableau Server that User's Permissions are evaluated by Tableau Serverto determine which objects the User can see, and what s/he can do with them.Tableau Server does this by evaluating the Permissions configured for the diferent objects vis-a-visthe User, either associated directly to the User or to Group(s) the User is a member of. This seems like a straightforward situation - the object's Permissions should be used, but it's not that simple.For Projects, Workbooks, and Data Sources, their configured Permissions are used.But for Dashboards and Worksheets, it depends... This is not clear in Tableau's documentation: Copyright (c) 2009, 2014 Chris Gerrard

Download as PDF here.