Is there any way to get a list of all the Worksheets and Dashboards in a Workbook as an output from Tableau?
This question was posed on the LinkedIn Tableau Software Fans and Friends discussion group recently. It echoes one of the fundamental needs that arises once Tableau's been in use for a while - knowing what's in your Workbooks, and where it is.
The simple answer to the question is: No.
Or at least not directly. But you you can find out.
If you want to get right to the get-the-answer part, jump down to the answer.
Tableau Desktop has no self-analysis abilities, no way to let you know what's in the Workbook you're looking at other than by browsing through it with the UI. One can simply walk through the list of Dashboards and open the Worksheets in each, recording their names as you go, but that's a boring, mechanical, error-prone process that's maddening in its ratio of effort to information achieved.
Tableau exists to make it easy to understand data. And the information about the relationships between Workbooks, Dashboards, and Worksheets is easily rendered as data, so it seems a natural fit for Tableau to be the vehicle for understanding the relationships. The fly in the ointment is that Tableau doesn't provide the data.
Solutions
Five or so years ago I was faced with the problem of determining what Dashboards were in the Tableau Workbooks my client had. Some of them I'd built, some of them were other people's creations. With a little poking around, and some connecting with people in the Tableau forums I found out Tableau Workbooks are XML files, and that other people were looking into how to tease this information out of them. Andy Cotgreave was exploring XSLT, which I'd started with but had to abandon when the cross- and back-references got too complicated for my limited skills. I built the Tableau Workbook Inventory System with Java, and over time bundled all sorts of functionality into it. Andy continued on and created his Access-based TWB Auditor.
TWIS and the TWB auditor both do the job, and lots more. But they might be too much tool for the many people who simply want the simple facts about what's where.
Simple and Easy - No Muss, No Fuss, Just the Basics.
I've been using Ruby quite a lot lately for data gathering and munging. Ruby makes it easy to browse the WWW and pull out lots of data that's not otherwise directly addressable by Tableau—e.g. HTML tables with embedded tags that Tableau sees as data delimiters.
It was pretty straightforward to put together a Ruby script to go through a set of TWBs and pull out their dashboards, worksheets, and the relationships between them.
Give Tableau some Ruby slippers and watch it dance.
The code immediately below is a Ruby script that will open every TWB in the current directory and pull out the Dashboards and Worksheets, and their relationships, into a CSV file named "TCC_BDW.csv". A description of how to use it and what it produces follows the code.
If you would like a ready-made script, along with a Workbook containing a starter Dashboard showing the Workbooks, Dashboards, and Worksheets, you can download it from here.
# TCC_BDW.rb
# This Ruby script Copyright 2012, Christopher Gerrard

require 'nokogiri'
require 'open-uri'

$recNum = 0

def init
    $f = File.open("TCC_BDW.csv",'w')
    $f.puts 'Record #,Workbook,Dashboard,Worksheet' unless $f.nil?
end

def pullSheets twb
  doc = Nokogiri::XML(open(twb))
  sheetNodes = doc.xpath("//workbook/worksheets/worksheet").to_a
  sheetNames = sheetNodes.to_a.collect! { |s| s.xpath("./@name").text}
  dashNodes  = doc.xpath("//workbook/dashboards/dashboard")
  dashNames  = dashNodes.to_a.collect! { |d| d.xpath("./@name").text}
  dashNodes.each do |d|
    dashName = d.xpath('./@name').text
    zones    = d.xpath('.//zone[@name]')
    dashNames.delete(dashName) unless zones.empty?
    zones.each do |z|
      zName = z.xpath('@name').text
      putCSV twb, dashName, zName
      sheetNames.delete(zName)
    end
  end
  dashNames.each do |d|
    putCSV twb, d, 'z...'
  end
  sheetNames.each do |s|
    putCSV twb, 'z...', s
  end
end

def putCSV(workbook, dashboard, worksheet)
  $recNum += 1
  $f.puts "#{$recNum},\"#{workbook.gsub('"','""')}\",\"#{dashboard.gsub('"','""')}\",\"#{worksheet.gsub('"','""')}\"" unless $f.nil?
end

init

Dir.glob("*.twb") {|x| pullSheets x }

$f.close unless $f.nil?
How to use TCC_BDW.rb
- Prerequisites
- Minimal technical skills.
- Have Ruby installed and ready to run.
- Have the Nokogiri Ruby gem installed—it's used in the XML parsing.
- Have TCC_BDW.rb in place—it doesn't matter where, or what name you use, as long as you know where it is.
You can:
- Copy the code above and paste it into your favourite text editor, or
- Download the existing one, along with the Dashboard/Worksheet Tableau workbook, from here.
- Running TCC_BDW.rb
- Open a command prompt.
(you can run it otherwise, but this is simple and straightforward)
- CD to the directory containing the Workbooks you're interested in.
- Run it: "[path to]\ruby [path to]\TCC_BDW.rb"
- If you downloaded TCC_BDW.zip, unzip it and copy its TCC_BDW.twb to the current directory.
- Open TCC_BDW.twb and see your Workbooks, Dashboards, and Worksheets all nicely organized.
What's in TCC_BDW.csv?
–or– what ARE the relationships between Dashboards and Workbooks?
The standard idea is that Dashboards contain Worksheets. This is true, but it's not complete. Some Dashboards contain no Worksheets, these are childless. Some Worksheets are contained in no Dashboards, these are naked.
In collecting the TWB information, TCC_BDW accounts for childless Dashboards and naked Worksheets thus:
- For every childless Dashboard, its record in TCC_BDW.csv contains the value "z..." for the Worksheet field. "z..." was chosen because Tableau's data sorting places after the other alphanumeric and special characters, and therefore it gets put at the bottom of Tableau's natural listings.
- Similarly, each naked Worksheet gets recorded with "z..." in the CSV Dashboard field.
Here are TCC_BDW.csv's first dozen lines when run against the Tableau v7 Sample Workbooks:
Record #,Workbook,Dashboard,Worksheet
1,"Finance.twb","Economic Indicators","sp1"
2,"Finance.twb","Economic Indicators","sp2"
3,"Finance.twb","Economic Indicators","sp3"
4,"Finance.twb","Economic Indicators","sp4"
5,"Finance.twb","Economic Indicators","sp1"
6,"Finance.twb","Investing in DJIA","Investment Growth"
7,"Finance.twb","Investing in DJIA","Investment Growth"
8,"Finance.twb","Investing in DJIA","Investment Growth"
9,"Finance.twb","Tale of 100 Entrepreneurs","Top IPOs 1"
10,"Finance.twb","Tale of 100 Entrepreneurs","Top IPOs 2"
11,"Finance.twb","Tale of 100 Entrepreneurs","Top IPOs 1"
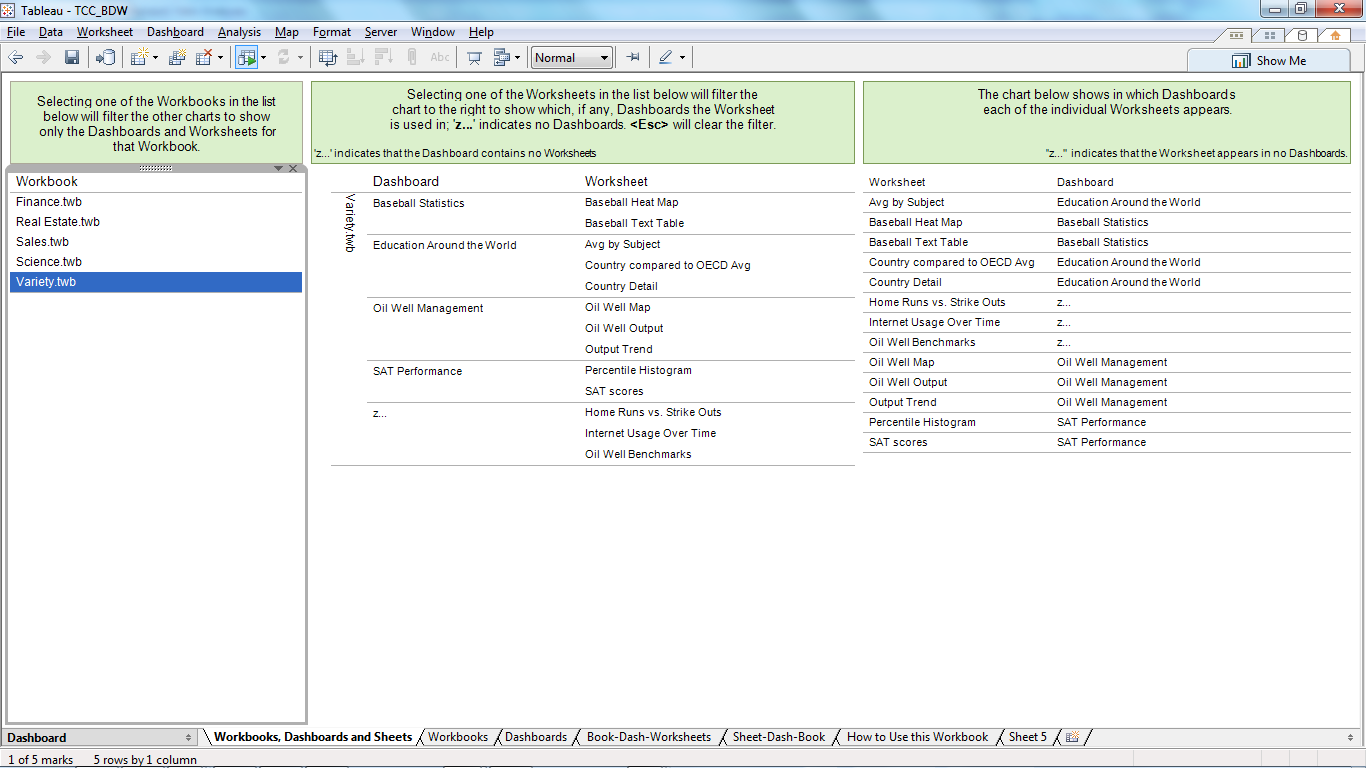
Here's a screen shot of TCC_BDW.twb showing how their Workbooks, Dashboards, and Worksheets are related:
Other Mysteries –or– what else can we get Tableau to tell us?
There are plenty of other things that Tableau can tell us, e.g. where and how data sources are used, field calculations–useful for ensuring consistency in metrics, where parameters are used. The list is long.
The list is a very long one, and as long as Tableau won't tell us on its own there will be ways to figure things out for ourselves.


