Thursday, April 25, 2013

Needed: More File Names and Better Interaction

Working with a lot of different Workbooks is interesting, challenging, satisfying, and on good days fun.

But it's not without its challenges. In a typical day I work with enough workbooks, from enough different places, to make anything that gets in the way of me getting to the one I need, when I need it, aggravating. Particularly when a client comes into the office with some thoughts on what they want or need next for their presentation; the one that's about to happen.

Cutting to the chase: Tableau's limit of nine Workbooks in its File menu is limiting, e.g.:

The screen cap above was taken on my trusty little laptop. Its screen isn't very large, but it's plenty large enough to accommodate at least twice as many recent file names as the current limit of nine. The file menu has plenty of room to grow downward, and the home page could certainly adjust the thumbnails and names to fit in that many, or more.

How it should work

The number of most recent files should be configurable, with a limit, if any, much higher than nine. Tableau is a tool designed to allow the user rapid friction-free access to data without restriction on the number of records, and what it the list of most recent files if not such a data set?

The new, improved, most recent file list should also be provided with mechanisms to help the user choose which file they're really after. In my example above, the first two files have the same name – they're separate working copies of one I was working on. The home page tooltip is helpful, but only minimally. It doesn't contain any information except the file's directory and name (and I'm happy for that), but it would be really if it provided more, and more interactive, information to help me choose which file I want. The file's size, last modification date and time, #s of dashboards, worksheets, and data sources would be nice. Something, say, like a mini-sheet of files that would make it much easier and clearer to see what I've been working on and when. And while we're at it, why not throw in a filter that would let me zero in on that one special file; Tableau Server has a basic filtering ability in its content presentations, why shouldn't Tableau Desktop?

Note that the "World Indicators.twb" tooltip will be activated from the "File" menu as well as from the home page.
There's no reason for Tableau to restrict itself to the obsolete Microsoft notions of what the proper menu structure and functionality for computer programs should be.

But wait! There's more!

While we're on the subject, this is only one more example of information about itself that Tableau should surface as data.

Um, where's this workbook?

The need: workbook organization and management.

The problem: Tableau offers very little in the way of help, and even provides bad information.

During the course of a typical day I work with many workbooks – as of this writing there are 932 TWBs and TWBXs in 106 folders in my working file system. Some of them are my clients', some are my own, some are Tableau samples, and the rest come from places I've forgotten about. Keeping them organized, each in its appropriate folder, is difficult. Looking for one I'm interested in can be a chore when I can't recall just where it lives.

I'm accustomed to applications that track the files I'm working on. They keep track of where the file was loaded from, and are happy to let me know, usually via the "File | Save As" option, or an equivalent.

Tableau Desktop, on the other hand, doesn't provide this information. In many, many cases, once you open a Workbook and try to find out where Tableau loaded it from, you're out of luck—Tableau won't reliably show you this information (unless you know where to look). What's worse, Tableau will lie to you, showing you a location from whence the Workbook did NOT come. This is extremely frustrating, particularly when one's working with a number of workbooks simultaneously and needs to keep track where each of them came from.

Here's a typical scenario, with screen caps:

I open "C:\tech\Tableau\Tableau Server\Tableau Server 8\Tableau Server 8 Permissions.twbx"

After working awhile, I think to myself: "Hmmm, I wonder which directory this version of the Workbook came from" and try the trusty old
"File | Save As..." option, at which point Tableau obliging shows me this dialog:


Well, that's clearly not right. I certainly didn't pick up the Workbook from the Tableau Repository.

So I try another tack, hoping to trick Tableau into showing me the location with the "File | Open..." menu option, and Tableau presents me with this:

Tableau has once again shown me the Tableau Repository, and it's still not this Workbook's home.

Why?

Why doesn't Tableau follow the standard convention and track the home directory of the Workbook it's currently holding? There's a very good reason for this—being—the convention, and I cannot think of a rational explanation for Tableau's idiosyncratic behavior.

There are times when it's good to break from convention – Tableau is at its core a departure from the once-standard approach to data analysis (although not as radical and absolutely innovative a departure as commonly thought). This isn't one of those times.

How it should work

Tableau's default behavior should be to track the home location of every file it accesses and offer that location up to the user when asked.

There are some circumstance when the user might wish for Tableau to behave differently, e.g. when consolidating a bunch of Workbooks into a common location. This could be accomplished by providing a mechanism for establishing a "default" location that could be invoked by the user when desired. But that's an edge case, should not be the out-of-the-box default behavior—and it opens the door for all of the Tableau configurations that the community has been clamoring for, because once a mechanism is in place for configuring one option it;s available for configuring others.

Caveat

I know that hovering on the file's icon in the home page will show me a tooltip with the file's home directory in it. And this is in itself a good thing. But it's one of those side effect situations where one needs to take advantage of an auxiliary feature to get something that should be front and center. Tableau is full of things like this, each of them adding its own little bit of friction.

Even the home page's tooltip is much less functional than it should be. You can't copy its contents, which would be really handy, and it doesn't show anything about the file other than its directory and name.

Wednesday, April 24, 2013

Why so stingy with the Site names list?

Is there a good reason to limit to ten the number of Site names in the "Select Site" page in the Tableau Server log in process?


Or was this one of those things left up to whomever put the page together, and to whom ten felt like a nice round number? It has that feel to it. Tableau is full of these things, that seem to have been implemented in isolation without the guidance of a real set of unifying design principles that provide a coherent paradigm for the overall product.

I am admittedly sensitive to things of this nature, having suffered the annoyance of being addressed as "Christophe" far too many times because of the once-standard ten characters in names data processing limit.

As the Tableau Server administrator for a very large, very diverse organization with many Sites, I run into the silliness of needing to scroll the Sites list up and down enough to make we want to have a nice quiet chat with whomever is responsible for this feature and explain why it's inadequate.

And while we're on the subject, we figured out good usability design patterns for helping people find the item they're looking for in a list better than 20 years ago. There are plenty of candidates that would be an improvement here, why not use one? Taking it a step further, Tableau should settle on an approach for this functionality and use it consistently across the product line – this would be a huge benefit in helping people actually use Tableau rather than trying to puzzle out its mysteries.

Tableau Server 8 Danger - inadvertent Site Administrator assignment

A Tableau Server Site Administrator has great power within his or her Site. In the wrong hands this power can cause great harm.

It's not a good idea to assign Site Administrator privileges other than to specific, responsible, knowledgeable Users who know what they're doing and can be trusted to do as little harm as possible.

Assigning Site Administrator privileges should be a deliberate conscious act, one with a higher burden of awareness and positive confirmation than is present in the simple act of registering an ordinary Interactor or Viewer. It would be very, very helpful if Tableau Server provided a secondary "are you sure" prompt in response to Site Administrator assignment, much like destructive operations like deleting worksheets require. (oh, wait, Tableau Desktop 8 doesn't do this any more - but that's another post)

It's a problem, then, that Tableau Server sometimes provide the opportunity for Site Administratorship to be assigned to a new User as a side effect of adding that User to a Site.

This is very bad.

Here's the scenario.

In an Active Directory authentication enabled Tableau Server installation, when adding a new User (Interactor only) to a Site the current admin mis-identifies the User. Tableau Server, unable to validate the user against Active Directory, returns an error message to that effect and provides the admin the opportunity to correct the User's AD name and resubmit. Upon doing so, with the name now correct, Tableau Server goes ahead and registers the User.

Only now the User is a Site Administrator.

How can this be? The admin did nothing positive to cause this to happen.

The fault is Tableau Server's. Upon presenting the "could not be added" error message to the admin, Tableau Server has, for reasons unknown, toggled the "Site Administrator" check box to active. This selection, being outside the admin's attention area, has a very high likelihood of being overlooked, thus causing the inadvertent assignment of Site Administrator to the new User.

Anticipating the "but the admin should be paying attention" claim that there's nothing really wrong here: sorry, but that's not a valid position.

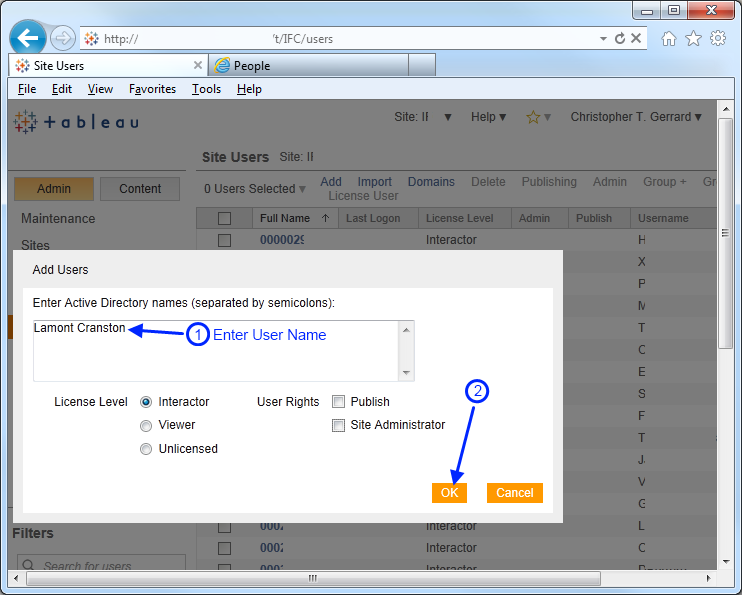
Here are the screen shots showing the events.

Adding a User

User Not Added - Name Not Legitimate

Correct the User Name

User Added to Site as Site Admin - not as intended


Tuesday, April 9, 2013

Tableau Server 8 Permissions

Here's an initial dashboard showing the Tableau Server 8 permissions. There are some additions from TS 7 to enable Web authoring.


As usual, the descriptions are truncated to the first 255 characters, an artifact of Tableau's use of the MS Jet engine for accessing Excel and CSV data. I'm planning on creating a proper Tableau Extract for the data using the new extract API, but it seemed prudent to not hold this back for that.

Sunday, March 31, 2013

Tableau Server 8 Improvement - Site Switching

Sites are good.

Tableau Server's sites are very handy for firewalling content. Judiciously used they make it much easier to isolate content so that only those users explicitly connected to the content's site can possible access it.

Tableau Server 7's site switching is confusing.

When logging in to a Tableau Server installation where he is registered with multiple sites the user chooses the active site from an initial list. Once logged in, switching from the current site to another requires the user to take an indirect route. He can log off and then re-log in, at which point the site selection list will be re-displayed, or he can select "Sites" from the maintenance section—but only if he's a Server Admin (and most users aren't), pick the site to switch to, and then select one of the new site's options.

This is tremendously obscure and unintuitive. Even worse, the normal selection mode convention is that when a selection is made from a list it actives the selection in the most obvious context, in Tableau's case selecting a site from the list -should- switch the context to that site, but it doesn't.

Tableau Server 8's improved site switching

As shown in the screen shots below, switching sites in Tableau 8 is far more obvious and intuitive than in 7. A simple click on the down-glyph next to the current site in the upper right of the page generates a list of the other sites. Selecting one of them immediately switches to it, making it the current site.

This new method is an immense improvement in two main ways:

  1. it elevates site-switching to the surface where it's a direct action, not a side effect
  2. it presents the list of sites in place, bringing it to the surface so the user doesn't have to go down another path to find it. 

It's not perfect

The placement of the Site: control in the upper right corner is problematic for several reasons. Most importantly it removes the information about the current site away from the information for the other current server elements. At this distance looking for the current site's name requires a substantial visual find-and-read operation. Moving it into proximity to the related context information would reduce this cognitive friction.

Speaking of which, as much as the UI has improved, there are still some obvious improvements to be made.

Without going into detail here, the current UI doesn't match Tableau Server's structural organization, and it should. Having a presentation model that's different from the structural/organization model is a cognitive mismatch that requires the user to adjust their mental model when aligning them. This makes it harder for the user to accomplish their tasks.

More on this is on its way.

Saturday, March 30, 2013

Tableau Server 8 First Blush - A Much Improved UI - Images

Thank you, Tableau.

I install, configure, and administer Tableau Server in different environments for clients with very different needs. Tableau Server hasn't made this easy, and in many ways has been a struggle.

Tableau's been paying attention to usability issues, and Tableau Server 8's UI is much cleaner and better organized.

I'll save the critical analysis for the future - I'm particularly interested in how Tableau has handled the complexity of the intersecting permissions involved with web publishing.

For now, I'm just going to soak up the nice newness, and present here the basic images of the new Tableau Server UI, from an administrator's perspective.

I've captured them in the minimal size I could get Windows down to, so they're going to be re-scaled to different proportions to fit in the blog – clicking on the individual images should provide you with a full sized view.

Wednesday, March 27, 2013

Tableau Recommends BDUF

BDUF - Big Design Up Front

  • the bane of everyone who wants to get things done
  • the curse of traditional BI, the reason why budgets blew up, time expired and value (or much of anything) wasn't delivered
  • the beast Tableau slew to wrest data analysis from the clutches of the BI technocrat cathedral builders and return it to real human beings with information needs

Why, then, is Tableau encouraging BDUF?

Preposterous, you say? BDUF is antithetical to Tableau's raison d'etre. Contrary to its nature. Expelled from its realm. Rejected in favor of a better paradigm.

Well, yes.

For the most part. But not entirely.

Take a look at this snippet from the online help for Tableau Server regarding project-level permissions:

Before you begin the process of creating projects and project-based permissions, Tableau recommends that you outline or document all of the projects and permission levels that you want users to have in each project prior to implementation in Tableau Server. This exercise will help you organize the various permissions you want to implement and may help you identify any user or permission gaps in your solution.

reference here

This is the very essence of BDUF - trying to determine everything that could possibly be needed before anything's actually put in place. Lots and lots of lost time and effort spent anticipating every possible need, all the potential combinations and permutations, identifying and working through all the subtleties, complexities, and consequences.

I love Tableau because as a data analytical tool it is the polar opposite of BDUF. With Tableau you don't need to know up front what visualization is going to give you the insight you need. You don't have to—you can walk the good path to it by simply following the data, using Tableau to illuminate your way.

So why BDUF here?

Why here indeed? What's different about Tableau Server permissions that impels Tableau to recommend conducting BDUF before you implement them?

Here's my starter list of reasons (it's only a starter list because I'm going to have to stop some time):

  • permissions, and the objects they attach to, form complex relationships
  • Tableau, as an analytical tool, has no ability to model or represent complex relationships
  • Tableau Server is not well designed for the presentation of the information about its contents
  • there's no straightforward way for Tableau Server to present to you the body of permissions, how they're attached to Sites, Projects, Workbooks, and other content
  • there's not even a simple, clear way to see the definitive permissions in place for a given User or Group on a given object - when a permission is identified as 'Inherited' it might as well be labelled "flip a coin"
  • without a presentation model there's no way to gain an understanding of what permissions are in effect for any object, much less for a group of objects
  • without a presentation model there's no way to provide the ability to manage the permissions – altering them with simple, straightforward deterministic mechanisms, and by this I mean deterministic from a human standpoint, not from a technological or implementation perspective
  • without the ability to see and understand the current permissions field it's impossible to know what it is—at best you can build up a mental model by walking around in it
  • without the ability to understand and manipulate the permissions field in a manner even approaching utility it feels only prudent to advise people to map everything out beforehand and then code (oops - configure strictly to spec – which is exactly what Tableau freed us from in the first place.

Is this a calamity?

No. It's a huge pain, and an embarrassment when, as the Tableau Server administrator, I can't definitively lay out the permissions in effect for an object in the tool, but its not a catastrophe.

Will it get better?

I hope so, but the irony of it is that I've been so busy managing our Tableau Server environments and trying to come up with some way to train someone without my deep interest in puzzling out the peculiarities, that's there's been far, far too little time for getting familiar and comfortable with Tv8.

What will it take to get better?

Tableau must, must, must break out of its data flatland.

Tableau was designed to handle flat data. Data with a uniform structure, everything in a linear path at a single level of granularity. And it's a fantastic tool for the job, the best there's ever been (this blog's grumping's not withstanding).

But the world's full of data that's not flat, that has all manner of topologies. Simple master-detail hierarchies. Multi-level hierarchies. Multi-level, multi-path hierarchies. Networks without hierarchies.

Quick question: what's the most common complex data that a Tableau user encounters?
Answer: Tableau

A Tableau workbook is a classic example of a complex data structure crying out for analysis. Here's a partial list of the relationships in a Tableau Workbook (there are enough elements to make your head swim–mine's been axle-wrapped plenty puzzling this stuff out building TWIS and the other tools):

  • A Workbook can have:
    • zero or more data sources
    • zero or more worksheets
    • zero or more dashboards
    • zero or more parameters (although parameters are structurally really data sources under the hood
  • A Worksheet can have:
    • zero or more data sources
    • zero or more row fields (and there can be duplicates)
    • zero or more column fields (and there can be duplicates)
    • zero or more fields in other controls
    • ...
  • A Dashboard can have:
    • zero or one title
    • zero or more worksheets
    • zero or containers (and knowing what and where these are is more useful than most people realize)
    • zero or more text, image, web page, and blank objects
    • zero or more actions
    • ...
  • A Data Source can:
    • access one or more tables (with 'table' a polymorphic term)
    • have one or more source data fields (at least I think one is the minimum, have to check that)
    • have one or more calculated fields – which in turn can reference zero or more data and calculated fields
    • be used in zero or more worksheets
    • not be used in dashboards directly
    • ...
  • And so on
  • and so forth
  • and such like.

I hope it's clear – Workbooks are pretty complex.

Permissions are roughly as complex in type, although not in number of elements

So... it's going to take the ability to model, present, and allow the user to interrogate complex data before Tableau has a real shot at helping people understand and manage their Tableau environments.

Can Tableau do it?

The evidence is not overwhelmingly in favor of success. Not only is it a really hard problem Tableau may have lost its mojo.

Conceiving, creating, and implementing these abilities is far, far harder than Tableau's initial inspiration–rendering in a visual interface the semantics of organizing and presenting quantitative data in a 2D visual space, with organizing elements providing nested sorting vertically and horizontally. The basic structural semantics were refined decades ago and proven in multiple successful products including RAMIS, FOCUS and NOMAD; of these FOCUS was the most well known. Oddly enough, these products were all capable of working with complex multidimensional data, that being the norm before relational databases decomposed everything.

So far, Tableau has provided a mishmash of different ways to present and provide interactivity to complex data. Formatting, particularly of tables, is the leading candidate for biggest flop–although there are definite relationships between the elements in a visualizations it's fiendishly difficult to keep straight exactly how you go about applying -this- formatting to -that- element. Tableau Server 7 has a plethora of different ways to present Sites, Users, Site Users, Projects, Views, Permissions, etc..

Want to see the relationships between your dashboards, the worksheets they contain, and the data sources they access? Good luck - Tableau doesn't provide this, even though the ability to see it has been available for several years, i.e.:

Gross Structure of the Variety Sample Workbook


It's a hard problem.

Providing a visual analytical interface to Variety's structure is a daunting task. One that abstracts it in a way that presents its type structure independently from its contents is difficult enough so that while to date there are plenty of good XML editors on the market there aren't any good XML analyzers.

Interestingly, at least to me, when I started out building TWIS, which created the diagram above, I was pretty much convinced that understanding and parsing Tableau Workbooks would be the hard part. And it was. But it was a challenging in two main dimensions that were both addressable by simply applying skills and approaches I, and other developers, already had. The biggest challenge, the one the eventually led me to the mini-tools approach of building lots of small Ruby apps (hello again, unix) was how to integrate all of the data from the various paths as I followed them down their individual rabbit holes.

I remain hopeful.

Tableau already cracked one nut–bringing a visual orientation to data analysis that provided a direct connection between the semantics of data analysis and the user interface. Can they do it with the next data frontier? Time will tell.

Tuesday, March 19, 2013

Tableau 8 is Digital Photography in a Film BI World.

I'm sitting here in D.C. at the Tableau 8 road show. Dustin Smith is presenting Tableau 8's abilities in advanced analysis. The big new features are all on display, and they're well worth spending the time to get very, very familiar with.

Dustin's also showing lots of not so big advances that make a real difference in the ease and velocity of analysis. This is terrific stuff.

Digital Photography?

Explaining why Tableau is such a great thing can be surprisingly difficult at times. One can wax rhapsodic about its elegance and clarity, its ability to achieve insights otherwise unattainable, its embodiment of high quality of analytical information design principles, its superiority to Excel, BO, Cognos, QlikView, [name your BI tool here]. And it can mean nothing, or even engender a skeptical response.

But... this one tends to resonate.

Tableau is like digital photography, and other tools are like using film.

Creating a data image in Tableau is nearly instant, it takes only a few seconds to get something really, really useful and valuable. And the cost per viz is almost zero, just like taking another digital picture is virtually cost free. Creating a Business Object report, or an Excel chart that needs a pivot table to be build first, is a costly, time-consuming activity that requires planning, setup, and development. time, energy, and effort.

This is Tableau's great virtue - the reduction in the barriers, the friction, between people and their data, just like digital photography removed the barriers between people and the pictures they take.

And, like the best digital cameras, Tableau can take great snapshots, but isn't limited to casual point-and-shoot. You can compose and create museum quality images with great fidelity and polish, with only a little more effort.

And now I'm off to take Tableau out into the data world and make great data images.

Wednesday, February 20, 2013

Tv8 Dashboard Quick Filters - Great, Flawed

Great

The ability to connect a quick filter on a Dashboard to any, or all, of the Dashboard's Worksheets is a huge big deal.

Not being able to do exactly this has been one of Tableau's most glaring design gaps for a long time. The lack of this functionality has led to all sorts of workarounds and tricks, all of which have had to their own problems, direct and indirect.

Flawed

The big fly in the ointment is that although it's really handy to know from which Worksheet an given quick filter came from, this valuable piece of information isn't put front and center. In order to find it, one has to navigate three levels down into the quick filter's context menu. This isn't a bad place for this information to be presented, but it's really ungood that one needs to dig down there to find it.

Principle Violation

Not providing relevant, valuable information in the primary context, where it's available without the User needing to dig around for it.

Tableau's value is in it's ability to provide easy, transparent access to the information in business data. It should take and zealously enforce the same guiding principle with its own information; in this case it doesn't.

This Tableau Public published workbook's dashboards demonstrate the situation.


Wednesday, January 30, 2013

Tv8 - Worksheet and Dashboard Menu Improvements

The existing menus

As seen on the left below, the current Tableau v8 beta (6) Worksheet and Dashboard menus are laid out very differently in the ordering of their individual menu items.

The lack of consistency in placement of corresponding menu items makes it much harder than it needs to be to develop the spatial sense of where the options are.

This in turn makes working with Worksheets and Dashboards through the menus much more of a hunt-and-peck operation than the smooth, low-friction activity it should be.

New Users will experience this cognitive mismatch as a significant barrier to achieving comfort, and even if they're not aware of it, will feel less welcome in the Tableau environment than they could, or should.

See the Tableau Public published Workbook for a clearer presentation: here.

The improved menus

These menus have been improved primarily by aligning the same, or equivalent, items into the same location, to the degree possible.

They also bring in the "Duplicate..." item. Having the ability to duplicate the current Worksheet or Dashboard from the keyboard is very, very valuable usability feature. "Duplicate Sheet" was in the Edit menu in Tableau v6, and was mysteriously dropped for v7. It's time it came back, along with its "Duplicate Dashboard" cousin.

The Worksheet menu also includes the "Format" option. Why is wasn't there is perplexing; "Format" is a pervasive menu option, occurring in many places in Tableau, it should be here.

I'm not sure whether "Duplicate as Crosstab" sohuld remain as a first-level Worksheet menu item, or if it should be one of the options on the submenu. So I left it in.

Saturday, January 26, 2013

Jittery Charts - Why They Dance and How to Stop Them

Tableau makes it so easy to create truly high quality visualizations that reveal valuable insights.

Combining individual vizzes into dashboards is a good thing. But it's not nearly as easy as it should be.

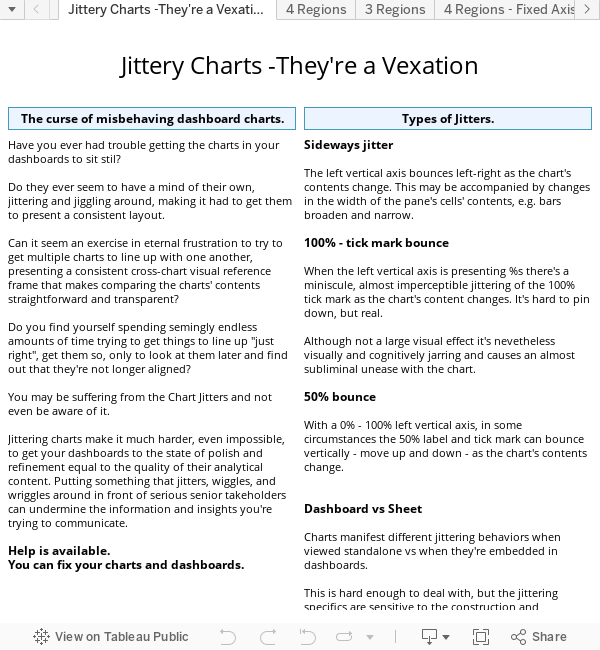
This post covers one of the subtle yet significant barriers to creating the highest possible visual quality presentations — chart jittering.

I've spent too much time trying to get the various components in my dashboards to be visually stable, both internally and with respect to their alignments with one another.

The following Tableau Public-published workbook contains my findings into trying to puzzle out this mysterious behavior, and what can be done about it.

One of the things that makes puzzling this out difficult and tricky is the sensitivity of the jitters to the context that the individual chart is presented in. It's particularly vexing that seemingly simple and innocuous dashboard changes can alter the jittering behavior of the charts it contains. I'm confident that I've only scratched the surface of everything there is to discover and document on the issue, but at some point enough is enough, particularly when a solution that works in the scenarios I've tested it is at hand.


Monday, December 17, 2012

Changing the Database Server Name in multiple Workbooks

It's good practice to use Tableau against a non-production database in many circumstances, e.g. when the database is under active development, you're early in the data exploration phase, or access to the production database is restricted.

Tableau workbooks tend to multiply, and their data connections in them multiply apace.

Changing the properties for a data connection or two isn't difficult, nor is it terribly burdensome. But it's a mechanical process, and after making the same change through the UI more than a couple or few times becomes boring, and when there's more than a few Workbooks it's really difficult to keep track of all the connections that need to be changed, those that have been, and those that have not yet been.

Here's a way to change the database server for a whole collection of Workbooks all at once.

Simple and easy, and in keeping with the small-apps approach, I've created a small Ruby app that scans all the Workbooks in a directory, locates those data connections with a server specified by name, and change the servers' names to a new one.

How it works — the "before" picture:

In the top section of the image below is a list of the Workbooks in the current directory. The bottom section shows the server names of the various database connections in these Workbooks.

For this post, we're going to change the "Ora.development.env.server" server names to "Ora.production.env.server"

How it works — making the changes:

In the first section of the image below I've executed the Ruby script: TTC_cds.rb. It first asks if I want to change database server names, and upon getting the answer "yes" asks for the existing (old) server name, and the new name to change it to.

Some important points — TTC_cds.rb will:

  • ONLY change the names for those servers with the one it's scanning for;
  • make a backup of those Workbooks that contains data connections to change to the new names; and
  • keep a record of the Workbooks it has scanned, and the changes it's made, in the CSV file TCC_ChangedDataSources.csv, where it is available for reviewing with Tableau.

The middle and bottom sections below correspond to the image sections above. We see that the server names have been changed according to our specifications.

A Tableau viz of the changed server names

The Magic Sauce

OK, it's just plain old Ruby code, but it works some magic.


# TCC_cds.rb - this Ruby script Copyright 2012, Christopher Gerrard require 'nokogiri' require 'open-uri' require 'fileutils' $oldServer $newServer def getInput work = false print "\n\tChange data sources? " if gets.downcase =~ /y|yes/ then print "\t Old Server Name: " $oldServer = gets.chomp if !$oldServer.nil? print "\t New Server Name: " $newServer = gets.chomp if !$newServer.nil? work = true end end end return work end def init work = getInput if work then $f = File.open("TCC_ChangedDataSources.csv",'w') $f.puts 'Workbook,Server Changed?,Server - old,Server - new' unless $f.nil? end return work end $xmlDoc = nil def oldServer? twb $xmlDoc = Nokogiri::XML(open(twb)) sNodes = $xmlDoc.xpath("/workbook/datasources/datasource/connection[@server=\"#{$oldServer}\"]") if sNodes.empty? return false else return sNodes end end def backupTWB twb original = File.basename(twb) $origCopy = original + '.originalDS' FileUtils .cp(original, $origCopy) end def changeServer twb, serverNodes serverNodes.each do |node| node['server'] = $newServer end nsf = File.open(twb,'w') nsf.puts $xmlDoc nsf.close puts "\t\t changed: #{twb}" puts "\t\t original: #{$origCopy}" end def changeDataSources twb serverNodes = oldServer? twb if serverNodes backupTWB twb changeServer twb, serverNodes $f.puts "#{twb.gsub(/"/,'""')},true,#{$oldServer},#{$newServer}" else $f.puts "#{twb.gsub(/"/,'""')},false" end end if init then puts Dir.glob("*.twb") {|twb| changeDataSources twb } end


No Workbooks are harmed during the database server renaming.

Your workbooks with server name changes are safely backed up.

How to use TTC_cds.rb

  • Prerequisites
    • Minimal technical skills.
    • Have Ruby installed and ready to run.
    • Have the Nokogiri Ruby gem installed—it's used in the XML parsing.
    • Have TTC_cds.rb in place—it doesn't matter where, or what name you use, as long as you know where it is.
      You can copy the code above and paste it into your favourite text editor.
  • Running TTC_cds.rb
    • Open a command prompt.
      (you can run it otherwise, but this is simple and straightforward)
    • CD to the directory containing the Workbooks you're interested in.
    • Run it: "[path to]\ruby    [path to]\TTC_cds.rb"
    • Note, unlike some of my other apps,TTC_cds.rb only looks in the current directory.
  • Presto. You now have successfully changed your Workbooks' database server names, where appropriate

The usual caveats.

TTC_cds.rb works fine with the limited testing it's been through, but it's definitely not bulletproof and hardened. It's entirely possible that it won't work on your Workbooks, or somehow mangles them. So use carefully. Always back up your Workbooks, or only run TTC_cds.rb against copies. .

I hope it works for you, but make no guarantees. If you do use it and make improvements I hope that you'll post them back here as comments so I can learn from them, and hopefully other people can benefit from them too.

Saturday, December 15, 2012

Understanding tabcmd with Tableau

Clarifying the tabcmd documentation

The Tableau Public-published workbook below is an example of using Tableau to improve upon something that's not generally considered to be analyzable data: the Tableau Server tabcmd online help documentation.

Although the online doc is reasonably comprehensive it's not readily digestible. The content's presentation space is very large and sparse — it's harder than it could be to get to the particular command you need, even harder to achieve a comprehensive understanding of the scope and details of the things tabcmd can do. If this were a normal Tableau Friction post, or a web content design critique, I'd point out the flaws in the online content. But it's not, and I'm not.

Instead, this post celebrates Tableau's ability to take a bunch of web stuff and render it in a way that actively supports our ability to find what we need, when we need it, and to gain a richer information context.

All in all, this is a pretty handy way to get to the tabcmd command you want, to understand what it does, how it does it, and how to get it to work.

If you find this interesting or valuable, please let me know.

If you find a way to improve it, I would really like hearing about it.

Tuesday, December 4, 2012

Technical-, not Human-Oriented Field Calculations

Tableau's Field Calculations — Sometimes a Mystery

Tableau sometimes does things in a way that makes sense from a particular technical perspective, but leaves non-technical people bewildered, wondering what happened. If they're lucky enough to realize that what did happen wasn't in line with their perfectly reasonable expectations.

This post illustrates a situation where Tableau's Calculated Field evaluation results in values for the calculated field that are in some circumstances not what the User intended or expected.

In this scenario, there are a set of records containing Budget, Released, and Spent values for US and Canadian States and Provinces. The User is interested in determining how much of the budget is unspent, or surplus, which from his/her perspective is exactly what the common meaning of that statement is.

Arithmetically the relationship is Budget – Spent, and in the case where no money has been spent the unspent amount is the full Budget amount. As we see below, when the data is in an Excel spreadsheet and the formula {Budget} - {Spent} is evaluated the result is exactly as intended. However, the arithmetically equivalent formula in a Tableau Calculated Field will produces an erroneous, from the human perspective, result when there is no data for the relevant Spent field.


Tableau's great grace is its human-oriented design that lets the User do the thing most natural to their experience and expectation with the confidence that Tableau will do the right thing.

As this example shows, Tableau sometimes doesn't live up to this promise. But that can, and should, be remedied.