Sunday, August 24, 2014

Tableau Server Role Permissions Revealed

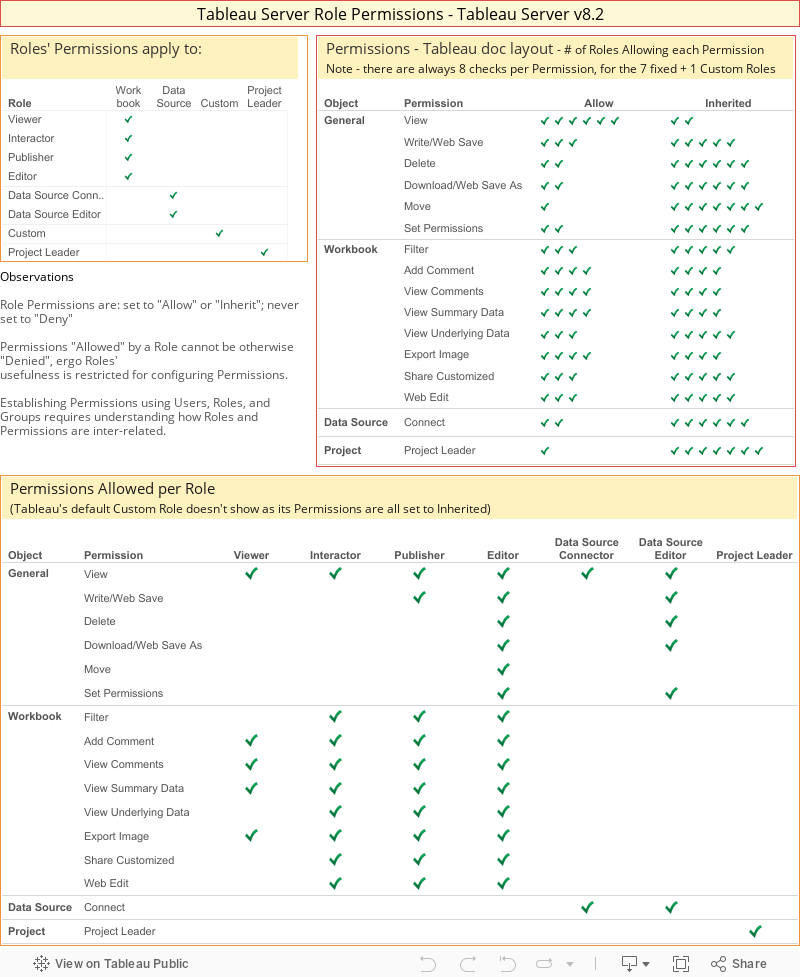
Please allow us to present, for your entertainment and edification, the one, the only, the Tableau Server Role Permissions:

One of the tricky parts of working with Tableau Server is getting the Permissions straight. Tableau's Roles are part of the mix, and can be useful in some circumstances (the whens and whereofs are themselves a topic begging for exploration and explanation, but that's for another time).

Understanding how different Roles' Permissions are configured can be difficult—like many parts of Tableau they're described individually, but with no consolidated documentation that brings them all together so that they can be seen at a glance and compared with one another. Until now.

Tableau Public-published Workbook

This workbook brings the Roles, their Permissions, and the Permissions' objects into a single view, helpful for achieving the holistic view necessary for understanding and employing them when it makes sense to. Comments and observations are below.

Screen Shots Tableau Server's presentation of the Roles' permissions.

Observations and Comments

  • None of the Roles' Permissions are ever set to Deny.
  • It's not clear from Tableau's documentation but unless a Permission is explicitly Allowed for an object it is effectively Denied - this makes using positive Allow-only Permissioning to be an effective strategy. (I'll be writing more on this)
  • Using Roles is reasonable as long as the Role's Permissions matches the set you need for the object, otherwise they need to be masked out and this introduces complexity that can be more confusing than if the Role wasn't used in the first place.
  • The name "Custom" for the 'Role' that's really 'Not one of the preconfigured ones" is unfortunate, in a number of different ways. It at least implies that there is -A- Custom role, when in fact what needs to be signaled is that there's a possibly unique blend of Permission configurations in effect for this User/Group for this object.
  • The lack of Role creation and management is a huge deficiency. It would be far, far easier, cleaner, and faster to configure Tableau Server to specific requirements if it were possible to create true custom Roles and apply them when and where they're needed. It would also make the whole system much more transparent—Tableau Server Admins would have a much easier time of understanding what Permissions are actually in effect, making it that much easier to support the business stakeholders who can't see what they're supposed to, or can see something they shouldn't.
    For example, it would be very nice to have a Role for viewing that allowed filtering but not the ability to see underlying data.
  • "Inherited" is a singularly bad name for what really is "Not Configured Here". One of the problems to using "Inherited" is that it means something to the great majority of people who see it very different from its meaning in Tableau Server, way is itself poorly explained and difficult to puzzle out.

I hope this is helpful. There's plenty more to explore and explain about Permissions, and I hope to one day get a good, concise explanation out into the world.

References

Tuesday, July 22, 2014

Perplexed by Permissions? Puzzled, Perhaps?

Have you ever tried to piece together all of the parts that affect what a Tableau Server user can and cannot do?

Have you ever tried to explain it to someone else, other than "It's complicated, complex, confusing, confounding, and mysterious"?

I feel your pain.

After pondering it yet again as I'm trying to figure out how to transfer this arcane knowledge to a client, I finally threw in the towel and sat down to try and map it out.

Here's the result (PDF online).

It's a decent first stab, I think, but I'll be keeping it up as I think of what to add to it, and how.

I'll appreciate any input anyone has, particularly things I've got wrong, followed by things I've missed and suggestions for additional information and presentation improvements.

Until then, happy Permissioning.

Sunday, March 23, 2014

Tableau 8.1 Keyboard and Mouse Shortcuts

Transcribed from: Tableau's online help.

Changing field names should be easier, and other Data window improvements.

It's a common scenario: you connect to a new data source and when Tableau shows you the data in the data window you're presented with lists of Dimensions and Measures with technical names, not the nice human-oriented names real people would find useful and engaging. For example, you see something like "customername" when "Customer Name" would make more sense to the person using Tableau.

There are a number of reasons for this, among the most common being we're frequently accessing data that was never intended for analysis by non-technical people, and that even when we are the database folks are reluctant to use human-oriented field names. In the customer name example above I've run into the situation time and again where the DB admins are reluctant to, and in some case flat refuse to put spaces in the names. From their perspective this makes no sense; if nothing else, it would mean enclosing the field name with quotes every time a SQL query is written. In their minds, this adds up to an enormous amount of extra typing because SQL querying it the only way one gets at the data, isn't it?

So time and again we need to supply real-human names for the fields so that they're more useful in Tableau. I know there are some skeptics out there who scoff at the necessity, but there are couple of compelling reasons. It's easier for people to read the names when they're spelled using normal conventions – that's why the conventions are there, with hundreds of years experience behind them. It also makes a difference in Tableau vizzes, making it easier for Tableau to display the field name in frequently limited header space (this would be dramatically enhanced if it was possible to use markup in display names, but that another friction point, for another post).

What's the big deal?

If you don't like the field names, you can just go ahead and change them, can't you?
Yes, you can. But it's a tiresome, boring task that takes much longer than it should, and it's boringness leads to mistakes and unnecessary rework.

Here are a couple of examples of the same data source.

Technical Names

While not as obscure as some of the data sources encountered in the wild, this data source's field names are missing spaces.

Human Names

In this example, the field names have been adjusted to contain spaces between their individual names. It might not look like much of a difference, but imagine what it would be like if all the field names were the really obscure technical names assigned with strict adherence to IT database design standards.

Changing names—how it's too much bother.

Invoking the field renaming.

This diagram shows the process required to get to the opportunity to rename the field.

There are four separate actions needed:

  1. Find the cursor. (it may not be where you expect it to be)
  2. Sweep the cursor to the field in the data window.
    These first two steps might not seem like much, but locating the mouse onscreen and then moving it to the field isn't a trivial action. The further away the mouse is, the more effort is required.
  3. Activate the field's context menu.
    There are a couple of ways to do this:
    • clicking on the down-glyph to the field name's right selects the field and activates the context menu in one action; or
    • clicking on the field, then right-clicking the field name takes two actions.
  4. Navigate to the menu's "Rename..." option.
    This example shows the option below the field name, but it's above the name when the field name is lower in the list.
  5. Select the "Rename..." option.
    Two ways: click it, or use the <Enter> key.

This is a lot of mouse-sweeping and selecting just to get to the point where we'll be offered the change to change the field's name.

The "Rename Field" editor.

Really. All the work done to get to this simple little one-field editor. Hardly seems worth the effort. (it's not)

And it's worse than it seems. Tableau always presents this editor smack in the middle of the screen, which means that the bigger the screen the farther away from the Data window it is, assuming that Tableau is normally positioned onscreen.

"Customer Segment" renamed.

Now the job's done, all nice and tidy, and we can relax.

But maybe it's not that simple.

What if we'd set out to rename all of the field names that need spaces added? If so, it would be really helpful to do them one at a time, top to bottom, to make sure that we got them all. A nice, organized approach.

It sure would be helpful if Tableau helped out in this undertaking. Little things could really help, like keeping "Customer Segment" selected in the Data window, showing us our last selection and making it easier to make the next.

But Tableau doesn't help us. In fact, for some odd reason Tableau unselects "Customer Segment" upon the name change, which makes no sense at all, and violates basic human factors and usability principles. Even stranger, if a field is selected, its "Rename..." option is selected but the name is not changed, Tableau keeps the field selected in the Data window. This doesn't make sense from a human standpoint and is an active impediment, and the different behavior upon rename/no rename is an active cognitive disruptor that generates confusion. The user gets the impression that Tableau is unpredictable and therefore untrustworthy and difficult to use.

Serial field renaming—an exercise in frustration.

Consider the situation where one wants to rename a series of field names. This happens quite a lot out in the wild.

One must go through this series of mechanical steps over and over:

  • Find the mouse.
  • Sweep the mouse to the field in the data window. (which field?)
  • Select the field.
  • Activate the field's context menu. (one or two actions)
  • Navigate to the menu's "Rename..." option.
  • Select the "Rename..." option.
  • Edit the field's name in the editor by: changing the name's text a submitting it via <Enter>; or selecting "Ok".
  • Find the mouse.
  • Move the mouse to the field in the data window.
    Which field?
    Surprise! Tableau unselected the last field you renamed so you have no visual clue as to which one it was, so you have to spend the cognitive capital to recognize and/or remember which one it is. This, coupled with the rote mechanistic series of operations is a horrible hodgepodge that creates real, and very substantial friction for the user.
  • etc. etc. etc.
  • Bored yet? Frustrated? Now imagine going around and around renaming a couple dozen or more field names. It's bad.

A Better Data Window

This data window improves upon the existing one by presenting both the user-facing human names and the internal/technical data source names.

The data names are on the right side, in the shaded zone, which conveys the sense that they're "behind the curtain" and not available for modification.

The human names are on the left side, in the lighter zone, and are editable. The rectangle around "Customer Segment" indicates that it is in an editable state, and that the user can rename it by simply changing its name in place. This is nicely simple and direct, a much better approach than the current renaming process.

It gets even better. Once the direct-configuration idea takes root, it's easy to imagine more of the field's characteristics being configurable in place. Obvious candidates are data type, formatting–notably for dates and measures, and measures' default aggregation. I'm seeing the field glyphs being used to trigger the in-place configurations.

Could this concept work? Yes, it could. There's no technical impediment, only the will to make improvements?

Is this the best design? Not very likely. This is a concept sketch, laying out one example of something that would work, and is a big improvement over the status quo.


An Even Better Data Window

Notice anything different about this Data window?

It might not jump out, but this Data window is a true independent Window, not a panel welded to the left side of the main Tableau application Window.

Freeing the Data window from the main Tableau Window's embrace has many real and substantial benefits. Most obviously, the Data window could stay open constantly, rather than needing to be popped up and down, which is a real pain, particularly given that the up/down toggle moves around sideways (itself a bit of vexation), and that it shares Tableau's left side with the Dashboard window and all of the formatting windows (and does anyone really know how many of them there are?).

I posted an initial bit on the desirability of scrapping Tableau's existing windowing architecture; it's a stub that I intend to keep working on, and the Data window is one of the top reasons I started down this path.

Monday, March 17, 2014

Configuring Quick Filters Takes Way Too Many Actions

Configuring Quick Filters is a mind-numbingly boring, repetitive sequence of finding and clicking that is many times more laborious than it should be.

There are two major dimensions to this problem. The first is the configuration of an individual Quick Filter. Every individual configuration option can only be triggered (on or off) through the same mechanical sequence.

On top of this is the really aggravating failure of Tableau to preserve one's carefully considered and tediously constructed configurations when the worksheet is added to a dashboard. Instead of respecting your configuration Tableau adds the sheet's Quick Filter's with the default configuration, and you then have to redo the configuration you've already done. This is madness.

more on this to come...

Tableau Needs a New Windowing Scheme

This is a bookmark post, I'll flesh it out later.

One of the very big frustrations of working with Tableau is the needless hiding, unhiding, and managing its various user interface components. The data window, dashboard window, and formatting windows (and there are far too many of them) all occupy the same real estate, and only one of them can be seen and interacted with at a time.

This basic architecture probably seemed like a reasonable idea when Tableau was created. The number of UI elements and zones was small and didn't get in each other's way too much. It was even probably good to have a fixed framework in that the user's attention could be focused on the analytical space without distraction. But those days are long gone and Tableau's UI architecture is now an impediment to accomplishing the things we really need to get done.

It would be much, much better if Tableau freed up the subordinate functional components so that they could be organized in ways that helped rather than hindered productivity. There are lots of examples of tools that do this well—I'll be adding some illustrative examples, mostly from a couple of my favourite tools: Inkscape and Paint.net

stay tuned, more to come

Wednesday, February 12, 2014

A New Horizon

I've been sitting on this post for quite a while thinking I'd improve it enough to make it suitable for publishing. But that's not going to happen in the near term, so here it is in all its roughness.
Note: it's in SVG (I use Inkscape for sketching) which all modern browsers should render.

Tableau is superbly designed for accessing and analyzing tabular data. It's nearly as good at this as can be, notwithstanding the oddity here and there. It's almost trivially easy to connect to a table, or to more than one table using joins, custom SQL, and/or data blending, and to analyze the resulting flat record set that Tableau eventually sees.

It's simple and straightforward to organize the data, and to generate quantitative visualizations of it, and everything works smoothly. As long as the data falls within Tableau's data conceptual envelope. Once the data lies outside Tableau's horizon working with it isn't so easy, and in fact the same analytical operations that work well on simple tabular data may produce precise, arithmetically correct, and wrong results.

It would be very, very handy if Tableau grew to accommodate data that it doesn't now understand and provide an elegant user interface for analyzing. It need not, but it should, if it wants to keep it's leadership position.

This post covers the next step in expanding Tableau's data horizon: the simple, straightforward master-detail data structure.

image/svg+xml Name Manager Budget First Name Last Name * Department Employee Hire Date Salary Department Digging Slate 147 HQ Granite 49 Name Manager Budget First Name Last Name Employee Hire Date Salary Department Digging Barney Rubble 02/02/02 16 Digging Fred Flintstone 01/01/01 17 HQ Rock Quarry 11/11/01 19 First Name Last Name Hire Date Salary Department Digging Barney Rubble 02/02/02 16 Digging Fred Flintstone 01/01/01 17 HQ Rock Quarry 11/11/01 19 Department - Employee <joined> Digging Slate 147 HQ Granite 49 Name Manager Budget Digging Slate 147 First Name Last Name Hire Date Salary one one and one one each of which has Employees Department Each also has some Name Manager Budget one one and one Department Each has some atomic attributes: Consider an ordinary company. It has a standard (simple) organizational structure, where employees work in Departments, each of which has a manager and distinct properties. That's easy enough to fix, here's a diagram showing the information structure:This is a typical presentation of hierarchical information,of the sort that's been around seemingly forever, at leastin the history of computer-assisted data processing.This structure is almost universally intuited, and hierarchicaldatabases structured to match the information of the businessdomain they served were the norm until table-based databasesbecame the new standard during the late '89s and 90s.(why this happened is an interesting story for another time, but we've been suffering because of it ever since) Here's a normal tabular representation of the company's Departments and Employee data.This is how data has been commonly represented for the past quarter century. Here's the tabular form of the data joined by Department Name.There are a number of ways to accomplish this, but they end up resolving to same single table that Tableau sees,or creates via data blending. Tableau is designed to access tabular data.It has no trouble connecting to these individual tables, and it's intrinsic default aggregation schem will return the values that mean what people think they mean,e.g. - showing the SUM(Budget) is correct whether it's for one or both Departments or Managers;- summing salary will similarly work for the different Employee dimensional contexts. This is good, but people frequently want to analyse the data for the whole organization, to see things like the sums of Salaries for Departments or Managers. In order to do this, the tables need to be related, in this case based upon the Department Name. While this is technically correct, in the degenerate relational database view of the world, it creates real and substantial analytical difficulties that manifest themselves as technical considerations the human analyst needsto be aware of and accommodate while analyzing the data or else risk achieving results that are arithmetically and technically correct in a narrow sense, but invisibly wrong in the human sense.The obvious case, using Tableau, is: if the user puts Manager on the Rows shelf and Budget and Salary on the Colums shelf, Tableau will generate this: Clearly, this is a nonsensical result.The value '294' doesn't make sense for the Digging Department. Department 0 100 200 300 Budget 0 10 20 30 Salary Digging HQ 294 49 19 33 Sum Budget, Salary per Department 294 is shown as the Budget sum because Tableau's default aggregation is SUM and 294 -is- the sum of the Budget values in the two records in the table Tableau's looking at.In Tableau's world, the analyst is responsible for knowing the technical details of the data's organizationincluding the differing table granularities, how they're joined or blended, and the analytical context in order tochoose the right aggregation to achieve sensible results.Here's how Tableau can be coaxed into showing the correct analytic: Note: MIN(Budget) Changing the Budget aggregation to MIN(), or any of the other aggregations that result in the identity value works.But it's a poor solution.Tableau should be smart enough to recognize the hierarchical relationship between Departments and Employees and implement the aggregation correctly according to the analytical context.It might seem like this is a bit of a pipe dream, that it's asking a lot, perhaps too much, of Tableau. That it's outsde of the world of "real" data that Tableau was designed to work with.Balderdash.Hierarchical data was the normal way of storing data before everything was 'relationalized" and decomposed into normalized tables that required recomposition before data with real world semantics could be available for analysis.And here's the best part: the problem of how to interpret an analytical request like "sum the Budget and Salary per Department" correctly in different analytical contexts was solved over thirty years ago, and formed the basis for entire families of data analytical tools. Modeling the Company's data as it should be. This is an abstraction of the technique of using a structural description (a master file descriptor (or MFD), and there's a prize to the first commentor to identify the reference) to identify the data contents and relationships. * Department Employee Name Manager Budget First Name Last Name Hire Date Salary Digging Slate 147 Fred Flintstone 01/01/1001 17 Barney Rubble 02/02/02 16 HQ Granite 49 Rock Quarry 11/11/01 19 MFD, schema, etc. Data Modern Data This is how we did it in the old days. The structural description was in a human- and machine-readable file and the data was kept in an optimzed dedicated file type designed for rapid access to its content. This kept the data really handy for retrieval during analysis. (say...) I've proposed this idea, that Tableau needs to recognize and accommodate sructural data relationships and sometimes hear something like: "well, that's all very nice and all, but modern data is stored in tables, and that's just the way things are".I don't think so.Here are a couple of examples of the Bedrock Mining Company data stored in modern forms. <company> <Department> <Name>HQ</Name> <Manager>Granite</Manager> <Budget>123</Budget> <Employee> <FirstName>Rock</FirstName> <LastName>Quarry</LastName> <HireDate>11/11/01</HireDate> <Salary>19</Salary> </Employee> </Department> <Department> <Name>Digging</Name> <Manager>Slate</Manager> <Budget>147</Budget> <Employee> <FirstName>Fred</FirstName> <LastName>Flintstone</LastName> <HireDate>01/01/1001</HireDate> <Salary>17</Salary> </Employee> <Employee> <FirstName>Barney</FirstName> <LastName>Rubble</LastName> <HireDate>02/02/02</HireDate> <Salary>16</Salary> </Employee> </Department></company> { "company": { "Department": [ { "Name": "HQ", "Manager": "Granite", "Budget": "123", "Employee": { "FirstName": "Rock", "LastName": "Quarry", "HireDate": "11/11/01", "Salary": "19" } }, { "Name": "Digging", "Manager": "Slate", "Budget": "147", "Employee": [ { "FirstName": "Fred", "LastName": "Flintstone", "HireDate": "01/01/1001", "Salary": "17" }, { "FirstName": "Barney", "LastName": "Rubble", "HireDate": "02/02/02", "Salary": "16" } ] } ] }} XML JSON XML and JSON are excellent examples of approaches that are moving away from relational/tablular data modeling and storage in order to accommodate modern needs. The NoSQL movement is increasing its presence in mainstream business data environments. Tableau technology partners aren't limited to the traditional relational database vendors; one of the major enterprise noSQL advertises that they store data internally as XML, even though the only visibilty to it through Tableau is via slices that resolve into single tables.It's worth noting that JSON is at the heart of the aggressive evolution occuring in data visualization, particularly the web-based javascript approaches that are capable of creating exquisite data visualizations, albeit with a modicum of programming effort, and the increasing sophistication of the technological abstractions are leading to the development of end-used based tools that will handle complex data easily, simply, and with very little friction. Beyond master-detail, the future beckons. The example above is the first step beyond flat tables. A two-level master-detail structure will enable an entire new world of analytical opportunities and abilities. But it's just a baby step.There are other horizons to reach, a whole new universe to explore.Beyond simple hierarchies are multi-level, multi-path hierarchies. Imagine if each Bedrock Mining Company department had, in addition to employees, vehicles and buildings they were responsible. It's easy to model this in XML, JSON, or any number of other data formats, but it's not easy to analyze the data, even though it might be interesting to see if there was any differential brake wear, comparing those departments with employees hired on or before the median date of hire fof all employees. When Tableau makes this a simple UI operation it'll really be on to something.But wait, there's more.Suppose you had an XML file containing data covering a diverse set of properties, with many hierarchical levels, many paths, and this is where it really gets interesting, non-parallet semantic relationships between elements and cross-linking across paths with references in one location identifying elements in a different structural path and at different levels. If only Tableau had the ability to allow access to something like this we could really work some magic. I've been waiting for this for five years; this is the complexity boundary that made creating TWIS so difficult. Tableau workbooks are complex in this manner, making it extremely difficult to distill from them a reasonable, finite set of data sources that surface all the information one is likely to be interested in finding out about their workbooks. If Tableau provides a simple, elegant design that makes accessing and anlayzing this Tableau workbooks this problem will be solved, and the future will be wide open. But there's no telling if it's in the works, or if it is how much longer it's going to be. Admittedly, these aren't trivial matters. There are very difficult problems to solve, technically and from the human/usability perspective.But someone's going to solve them. And that will be good. Using blocks this way, the properties are straightforward and easy enough to understand, but something's missing ; it doesn't capture anything of the essence of the relationship betwen Departments and Employees.